EUR/USD Weekly Forecast: ECB decision unlikely to rescue the Euro
- The Middle East crisis intensified, pushing away hopes for a quick resolution.
- United States inflation unexpectedly rose by less than anticipated in June.
- EUR/USD’s bearish case gains strength with lower lows in sight.

The EUR/USD pair has shown little progress over the last few days, seesawing around the 1.1450 mark throughout the week to finish a handful of pips below the level. Mounting tensions in the Middle East pushed investors into cautious mode despite temporary relief from macro data.
The Strait of Hormuz is closed again
The United States (US) and Iran exchanged fresh waves of strikes for the sixth consecutive day on Thursday, as both sides aim to control the Strait of Hormuz. Iran said the critical passage will remain closed until Washington accepts that control of the Strait must be brought under Tehran’s authority and ends hostilities. The fragile ceasefire collapsed as the Islamic Revolutionary Guard Corps (IRGC) and the US re-imposed a strict naval blockades. The Memorandum of Understanding (MoU) signed on 17 June is no longer in place, and concerns about Oil prices re-triggering inflationary pressure are slowly taking their toll.
Easing US inflation brings temporary relief
The US Dollar (USD) recovered its safe-haven appeal, although gains were limited by decreasing odds for a rate hike following the release of the US Consumer Price Index (CPI). Annual inflation as measured by the index declined to 3.5% in June from the three-year high it set at 4.2% in May, while the core annual reading eased to 2.6% compared to the previous 2.9%.
The Producer Price Index (PPI) in the same month also rose by less than anticipated in June, with the annual figure printing at 5.5%, following the revised 6.0% posted in May.
The figures prompted investors to reduce bets on Federal Reserve (Fed) hikes, yet the resumption of the war stands as a red flag, hinting at temporal relief as Oil prices are back on the rise. West Texas Intermediate (WTI) Crude Oil barrel hovers around $80, far from the peak above $120 but again rising from around pre-war levels at $65.
By Friday, the US published the preliminary estimate of the July Michigan University Consumer Sentiment Index, which improved to 54.4 from the previous 49.5, while surpassing expectations of 51. More relevantly, 1-year inflation expectations eased to 4.2% from the previous 4.6%, although 5-year inflation expectations remained unchanged at 3.3%.
Fed Chair Kevin Warsh testified before Congress in his first semiannual appearance. Warsh remarked that inflation stability is critical and that the central bank has no tolerance for persistently elevated inflation. He also repeated that forward guidance is out of the picture and that a “new chapter” on communication is starting. Warsh brought nothing new to the table, with investors more focused on easing inflation than on any clues in his words.
European Central Bank meets again
The European Central Bank (ECB) is having a monetary policy meeting on July 23 and is expected to hold rates unchanged following the June hike. First, because recent inflation data was encouraging, and second, because so far, Oil and Natural Gas prices are within tolerable levels. Market players, however, maintain a primary bet on a potential hike in September, when the central bank will publish fresh economic projections. Those hiking bets will likely gain relevance and adherents should the Iran war continue.
Just on Friday, the European Union Harmonized Index of Consumer Prices (HICP) was confirmed at 2.8% YoY in June, down from the 3.2% peak posted earlier in the year.
European policymakers had made a point of being more concerned about acting late on inflation upticks than inflation itself. Regarding the economic outlook, officials are still noting that progress may be weak, but overall they agree on a resilient economy.
Still, the ECB announcement is unlikely to have a relevant impact on the Euro as the focus returns to the war. Whatever policymakers say, or do not, these days could be disrupted by an escalating war. And that’s also valid for the Fed. Warsh may refuse to give forward guidance, but speculative interest will rush to price in rate move odds according to how Oil prices unfold.
What’s next in the docket
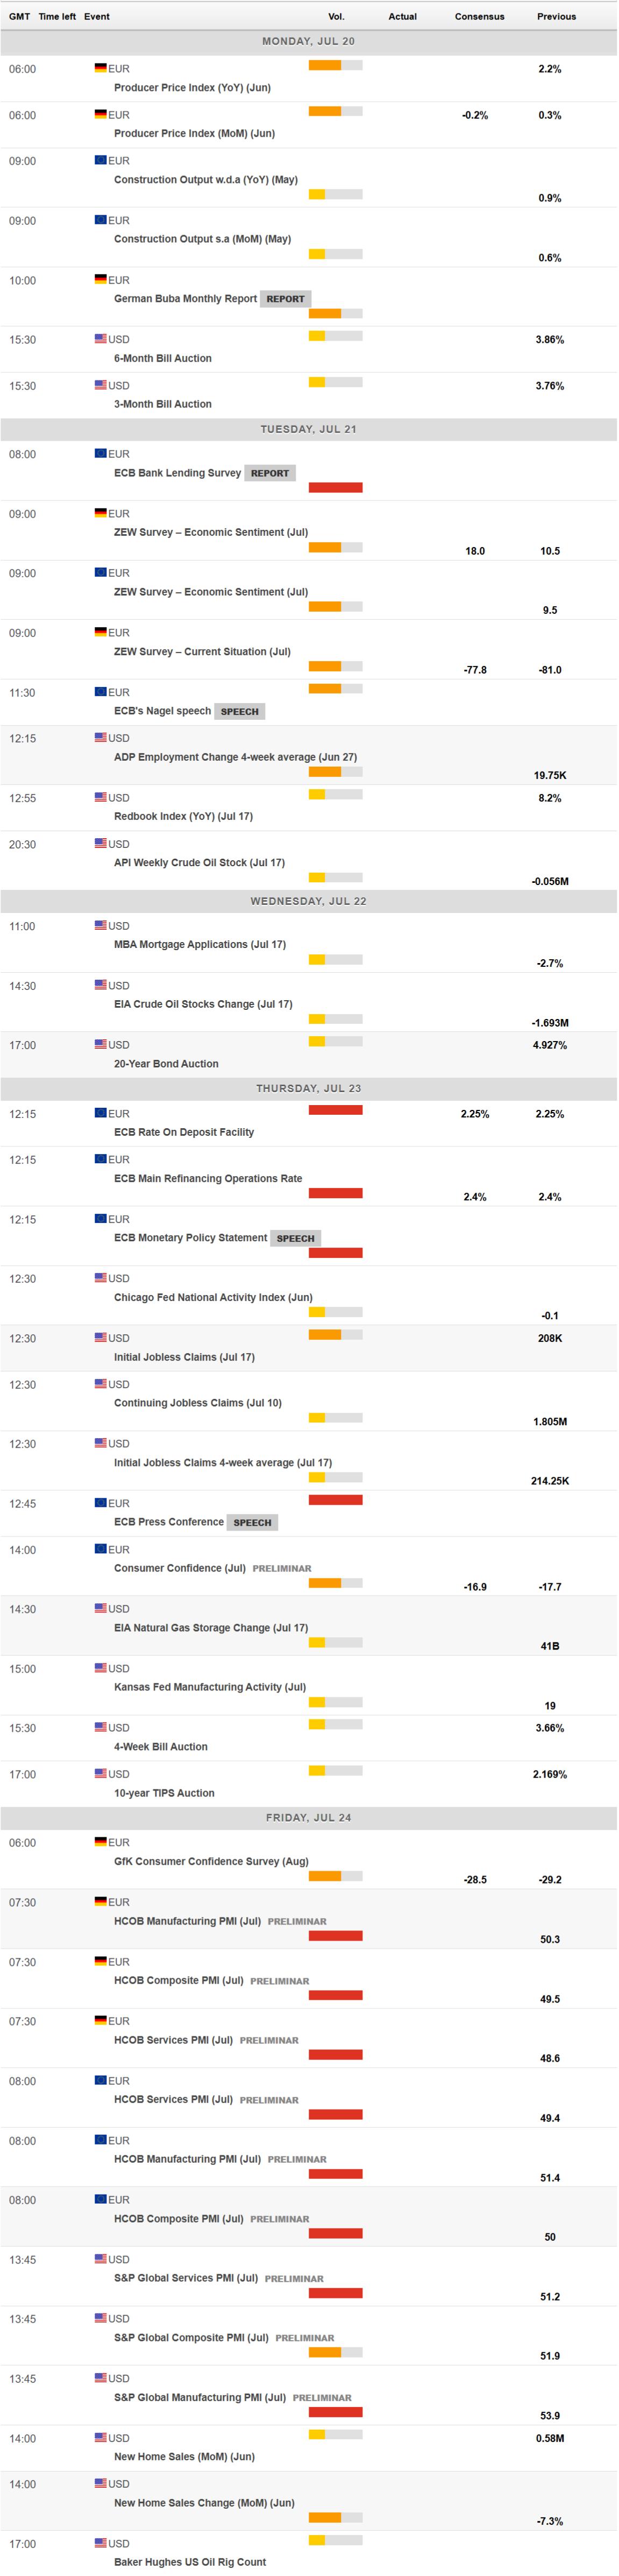
Beyond the ECB announcement, the calendar will offer some interesting figures. Germany will publish the June PPI and the July ZEW survey on Economic Sentiment, while the EU will unveil the preliminary estimate of July Consumer Confidence. The US has little to offer, although next Friday, S&P Global, alongside local banks, will release the preliminary estimates of the July Purchasing Managers' Indexes (PMIs) for most major economies, a key barometer of business growth.
EUR/USD Technical Outlook:
From a technical point of view, EUR/USD is at risk of falling further. In the daily chart, the pair trades below the 100-day Simple Moving Average (SMA) at 1.1585 and the 200-day SMA at 1.1641. The pair stands above the 20-day SMA at 1.1414, but maintains a modest downward slope, limiting its relevance as support and still indicating near-term downward pressure. At the same time, the Relative Strength Index (RSI) indicator aims lower toward around 47, while the Momentum indicator has also turned lower, yet remains around its midline, hinting at persistent selling pressure.
On the weekly chart, EUR/USD maintains its bearish bias, holding below the 20-week simple SMA at 1.1573 while remaining above the 100- and 200-week SMAs at 1.1305 and 1.1015, respectively. The 20-week SMA acting as overhead resistance suggests rallies are capped for now, while the RSI Indicator around 42.7 and the negative Momentum Indicator reading hint at waning bullish pressure and favor further consolidation or mild downside rather than an impulsive recovery.
On the downside, the immediate support level is the 20-day SMA at 1.1414, and a sustained break beneath this floor would expose 1.1324, the June monthly low. Further declines open the door for a test of the 1.1200 mark. On the topside, initial resistance is seen at the 1.1470 price zone, a long-term static conflict level, followed by the 100-day SMA at 1.1585, and later by the 200-day SMA at 1.1641-
(The technical analysis of this story was written with the help of an AI tool. Know more.)
Author

Valeria Bednarik
FXStreet
Valeria Bednarik was born and lives in Buenos Aires, Argentina. Her passion for math and numbers pushed her into studying economics in her younger years.