EUR/USD structural report: Four-hour structure engine drops to -19.2° as 1.0990
- EUR/USD compresses at the 1.0990 baseline following an extended directional impulse drop from the 1.1390 cyclical distribution zone.
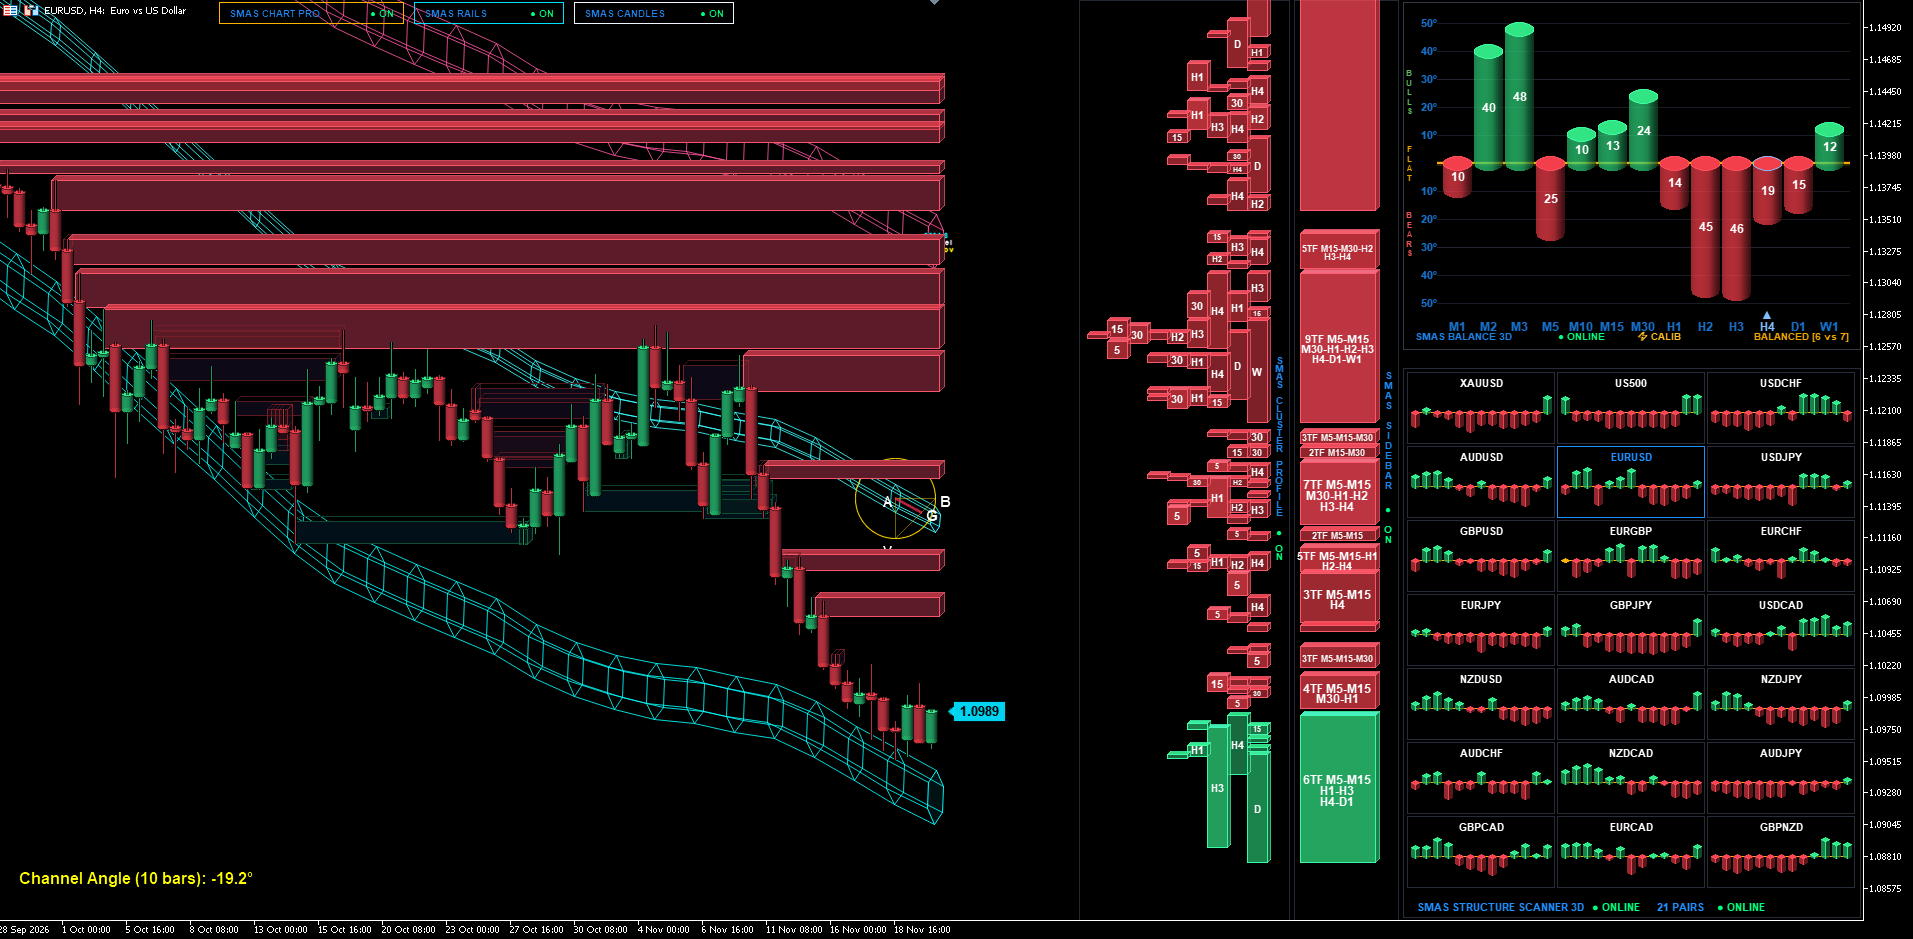
- The Structure Engine 10-bar vector confirms an authoritative -19.2° descending trajectory, supported by severe senior execution drag reaching -45° on H2 and -46° on H3.
- Multi-order liquidity mapping registers Overhead Structural Saturation as a colossal 9th-Order Titanium Super-Cluster (9TF: M5–W1) anchors directly above, capping any realistic counter-trend expansion.


Market context and the 1.0990 structural battleground
On the four-hour execution continuum, EUR/USD (Euro vs US Dollar) is experiencing a high-density volume-absorption sequence around the 1.0990 structural pivot. Following a relentless cascade of programmatic selling that originated from the upper distribution plateau, price action has entered a temporary compression phase directly above resting institutional liquidity.
Rather than indicating an institutional accumulation base or trend reversal, the localized stall around 1.0990 represents liquidity replenishment. Market participants are absorbing resting limit bids while sellers reload short inventory directly underneath a dense succession of overhead supply slabs.
Structure engine kinetic slope (-19.2°) and channel trajectory
The central ordinary least squares (OLS) regression axis generated by the SMAS Structure Engine projects an uncompromising bearish trajectory. The scale-invariant radial measurement across the 10-bar vector (Triangle A–B–V–G) registers a steep downward angle of -19.2°.
The 3D volumetric rails demonstrate that spot prices remain pinned within the lower quartile conduit of the master descent channel. The kinetic energy of the downshift remains deeply entrenched in negative territory. Until price physically breaks out of this downward regression envelope, any upward rotation is mechanically classified as a structural dead-cat bounce within an overarching trend regime.
Multi-timeframe phase telemetry (Structure balance 3D)
The SMAS Structure Balance 3D telemetry presents an illustrative profile of Terminal Counter-Trend Absorption (BALANCED: [6 vs 7 TF]):
- Micro-intraday counter-flow: The lower-tier spectrum exhibits localized buying pressure, led by M2 (+40°), M3 (+48°), and M30 (+24°). This represents minor tactical short-covering and intraday scalping into the round psychological handle.
- Macro-scale institutional alignment: The senior structural continuum remains heavily locked into bearish territory: H1 (-14°), H2 (-45°), H3 (-46°), H4 (-19°), and D1 (-15°).
The severe twin peaks at -45° (H2) and -46° (H3) indicate that medium-term institutional order flow is actively leaning against the minor retail bounces seen on M2/M3. The localized buying energy is being rapidly exhausted against the macro bearish baseline.
Order-book massifs and liquidity clusters (Sidebar 3D)
The SMAS Sidebar 3D and Cluster Profile define absolute structural barriers that govern near-term price boundaries:
1. Immediate overhead resistance (Structural massifs): Directly above the market sits an unyielding, layered roof of multi-order supply:
- Intermediate slabs: 4TF (M5–H1) and 3TF (M5–M30) spanning 1.1020 to 1.1065.
- Auxiliary formations: 7TF (M5–H4) multi-session supply shelf at 1.1110.
- Monolithic ceiling: An impenetrable 9th-Order Titanium Super-Cluster (9TF: M5-M15-M30-H1-H2-H3-H4-D1-W1) sitting between 1.1150 and 1.1220, representing total institutional convergence across nine time horizons.
2. Underlying Demand Shelf (Target Vector): The nearest significant structural demand sits as a 6th-Order Macro Splay (6TF: M5-M15-H1-H3-H4-D1) positioned between 1.0910 and 1.0945, which serves as the primary downside target coordinate.
Actionable institutional execution protocol
With the master channel maintaining a firm downward slope of -19.2°, macro telemetry on H2/H3 registering extreme readings of -45° / -46°, and spot price locked beneath intermediate 4TF supply slabs, execution protocol favors high-convexity trend continuation selling:
- Execution setup: Trend-Continuation Short on Retracement Exhaustion.
- Entry Zone (Short): 1.1005 – 1.1035 (Targeting premium fills on intraday test of the active 4TF Supply Shelf).
- Structural invalidation (Stop Loss): 1.1085 (Positioned safely above the 7TF structural cluster boundary; calculated risk ~50 to 80 pips).
- Take profit 1 (50% Volume): 1.0940 (Upper boundary of the 6TF macro demand massif; +65 to +95 pips / Move SL to Breakeven).
- Take profit 2 (Macro Expansion): 1.0870 (Kinetic channel projection into untraded liquidity pocket; +135 to +165 pips).
- Asymmetric risk /reward: Exceeding 1 : 2.4.
Structural invalidation: A confirmed four-hour close above 1.1085 breaches the intermediate supply containment layer, invalidating immediate downward acceleration and enforcing a structural neutralisation toward the senior 9TF massif at 1.1180.
Author
Andrey Shvedov
SMAS Quantum Research
Andrey Shvedov is an active quantitative trader, software architect, and financial market researcher with over 24 years of live market microstructure experience.

















