CPI preview September 2026: Energy drives headline, but core is where the real action is

We are likely looking at a split-personality CPI report for September. On one hand, headline inflation is set for a pretty sharp acceleration. On the other hand, core inflation will probably look a lot more behaved. The culprit behind this divergence? A massive spike in gasoline prices. For anyone trading the US Dollar, keeping these two metrics separate is going to be absolutely vital today. An energy-driven spike hits the market completely differently than a broad-based, sticky core surprise. The Fed reacts to them very differently, too.
Our forecast vs street consensus
- Headline CPI: +0.5% MoM / +3.6% YoY (Forex Factory consensus sits at 0.6% / 3.6%).
- Core CPI: +0.2% MoM / +2.4% YoY (Consensuses sits at 0.2% / 2.5%).
What does this mean? Basically, we are calling for a slight downside miss on the monthly headline and the annual core figure. As for the monthly core print? We are dead in line with what the market expects.
The energy surge lifting headline numbers
Let’s talk about our anchor. We didn’t build an isolated, proprietary black-box model for this forecast. Instead, we are heavily relying on the Cleveland Fed nowcast, which was just updated on October 13. Their team pegs headline inflation at 0.53% MoM and core at 0.20% (with annual projections at 3.60% and 2.39%, respectively).
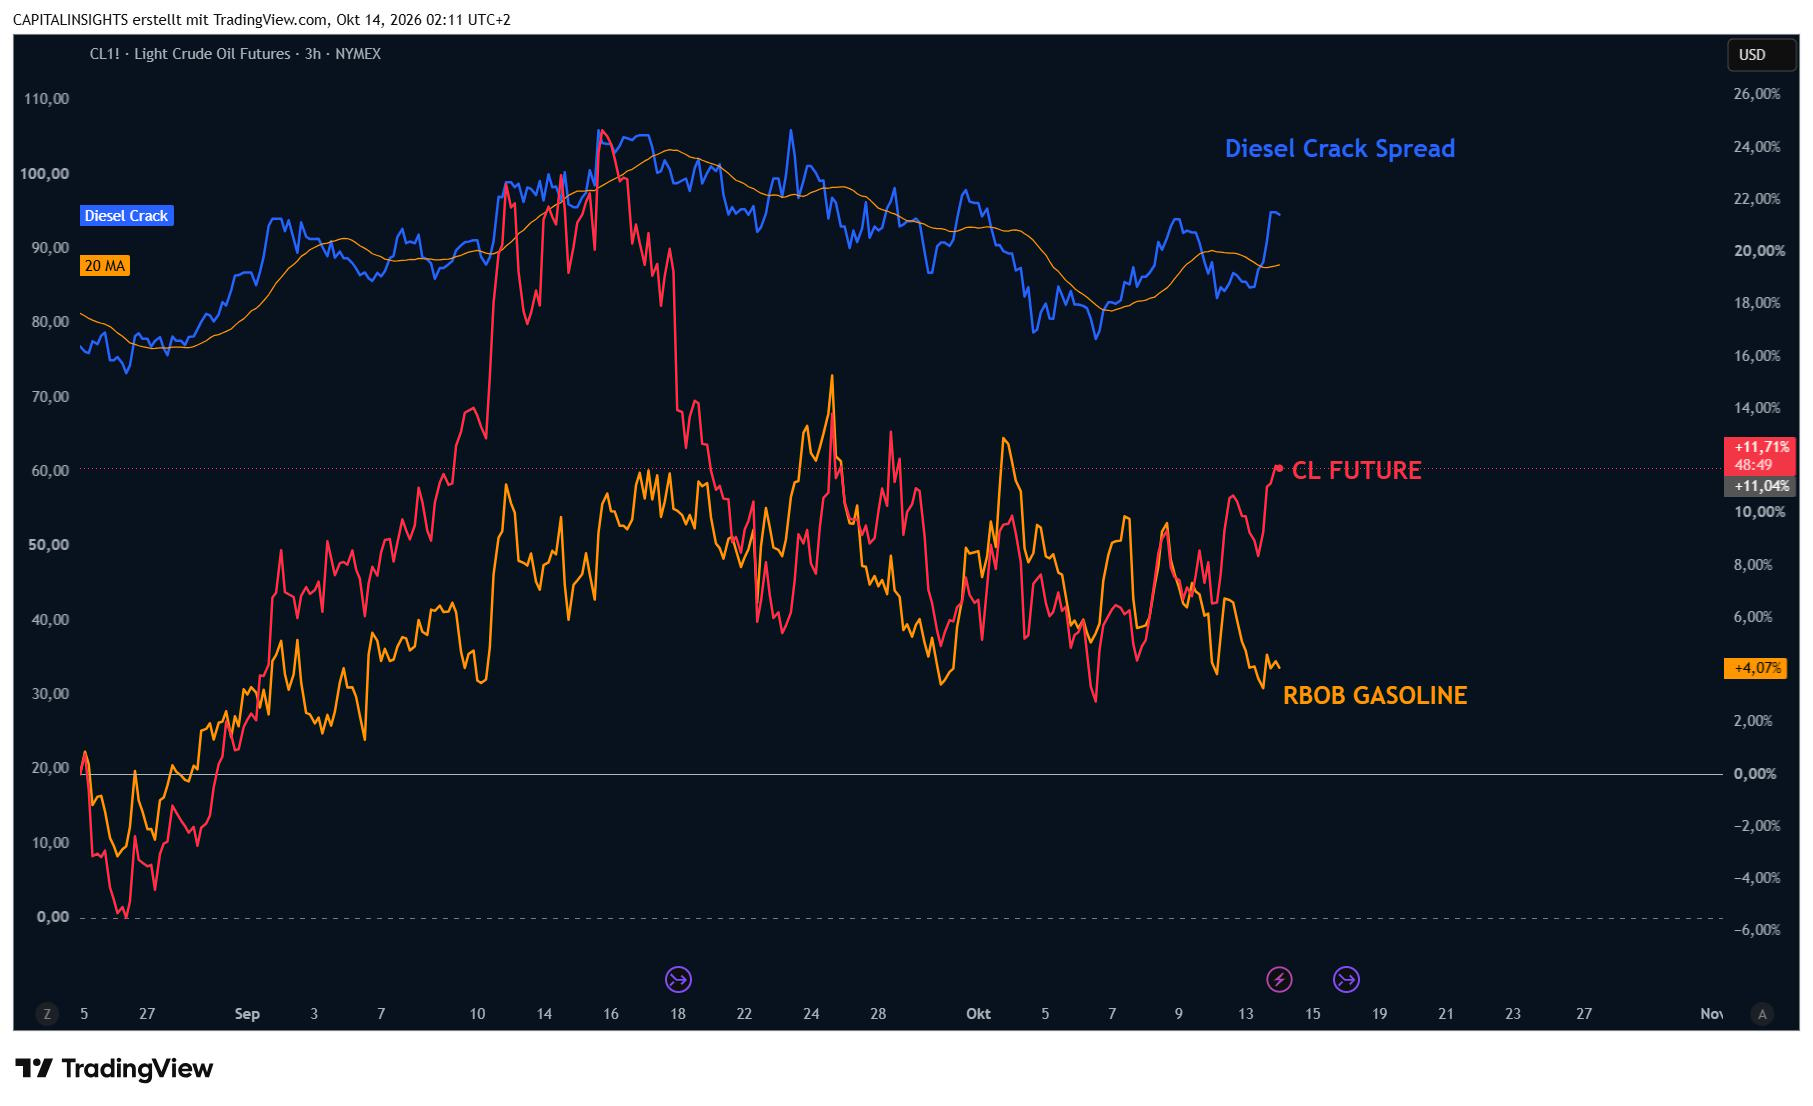
The retail energy data out there absolutely backs up this upward headline momentum. Just look at the EIA monthly numbers. Average US regular gasoline prices surged from $4.058 per gallon in August to $4.355 in September. That is a massive 7.3% jump in a single month.
Now, a quick reality check: this is a raw, unadjusted retail price change. You cannot just plug that directly into the seasonally adjusted CPI formula and call it a day. But it clearly tells us that household fuel budgets took a beating last month. Since the Cleveland model already bakes in this energy noise, we didn't add an extra "discretionary uplift" to our numbers. Doing that would just be double-counting the same exact pressure.
Honestly, the case for a hot headline print is incredibly solid. The real debate is whether it lands at 0.5% or 0.6%. Given that statistical noise, you should view our slightly below-consensus call with a healthy dose of skepticism.
Business costs are sticky, but pass-through is a mess
Look back at the August PPI report for a second. Final-demand prices rose 0.4% MoM, while the core PPI (excluding food and energy) only ticked up 0.2%. Energy costs actually drove more than three-quarters of that entire goods-price increase. Meanwhile, aggregate services only grew by a tiny 0.1%.
What does this tell us? Pipeline cost pressures are definitely still lingering, but they aren't forcing a massive, immediate breakout in core consumer prices. Producer and consumer baskets just don't match up perfectly. Plus, businesses don't always pass costs down the line immediately—sometimes they just swallow the hit to their profit margins, or they wait a few months to hike prices. By the way, September PPI drops on October 15, so it won't help us unpack today's CPI reaction.
However, if you want a real warning sign, look at the September ISM surveys. They paint a much more aggressive picture:
- Manufacturing prices paid: Shot up to 77.9 from 71.1.
- Services prices paid: Climbed to 74.0 from 72.6.
Keep in mind that these are diffusion indexes. They don't measure the exact percentage size of price hikes; they just tell us how many companies are reporting higher costs. It means the upside risk to core CPI is very real. While we are sticking to our 0.2% call, a 0.3% core print is definitely the biggest threat to our baseline view.
Housing might just save the day
On the flip side, housing might offer a bit of a cushion. The national Zillow rent data—which currently runs through August—shows that short-term momentum is cooling off. Monthly rent growth slowed from around 0.39% in June to 0.28% in July, and hit 0.20% in August. Here is the catch: annual growth still managed to climb to 2.48% in August. So, we have a situation where cooling monthly data is coexisting with a firm annual baseline.
We know the official CPI shelter metrics are notoriously slow. They lag the real-time market because they look at existing rental leases, not just new listings. So, you can't use Zillow as a 1:1 predictor for September's official shelter numbers. That said, Zillow’s standalone September shelter model is projecting a modest 0.22% monthly increase in Owners' Equivalent Rent (OER). If that holds, it means we will get a very manageable contribution from the biggest component of the core basket, leaving the surprises to happen elsewhere.
For context, August’s published numbers were 0.4% for headline and 0.3% for core. We are forecasting a faster headline but a slower core. Don't forget that annual rates are heavily influenced by "base effects" (what happened exactly one year ago), which is why monthly momentum and annual inflation don't always move in the same direction.
The trading playbook: Dollar and Gold
If the print lands right on our forecast, the market will probably breathe a quick sigh of relief. But remember: a 0.2% monthly core is already heavily anticipated. The only real downside surprise would have to come from a softer headline or the annual core comparison. Even then, if the underlying sub-categories look sticky, any market relief might be short-lived.
What if we get a 0.6% headline and a 0.2% core? That matches the consensus perfectly. Markets would just be reacting to an expected outcome, even if the headline beats our specific forecast.
The real fireworks happen if we get a hot core print—say, 0.3% or higher—especially if the strength is broad-based across both goods and services. If that happens, the "higher-for-longer" narrative is back on the table. Treasury yields will spike, the Dollar will catch a massive bid, and Gold along with rate-sensitive equities will get hammered. On the flip side, a broad-based miss across the board would trigger the exact opposite reaction.
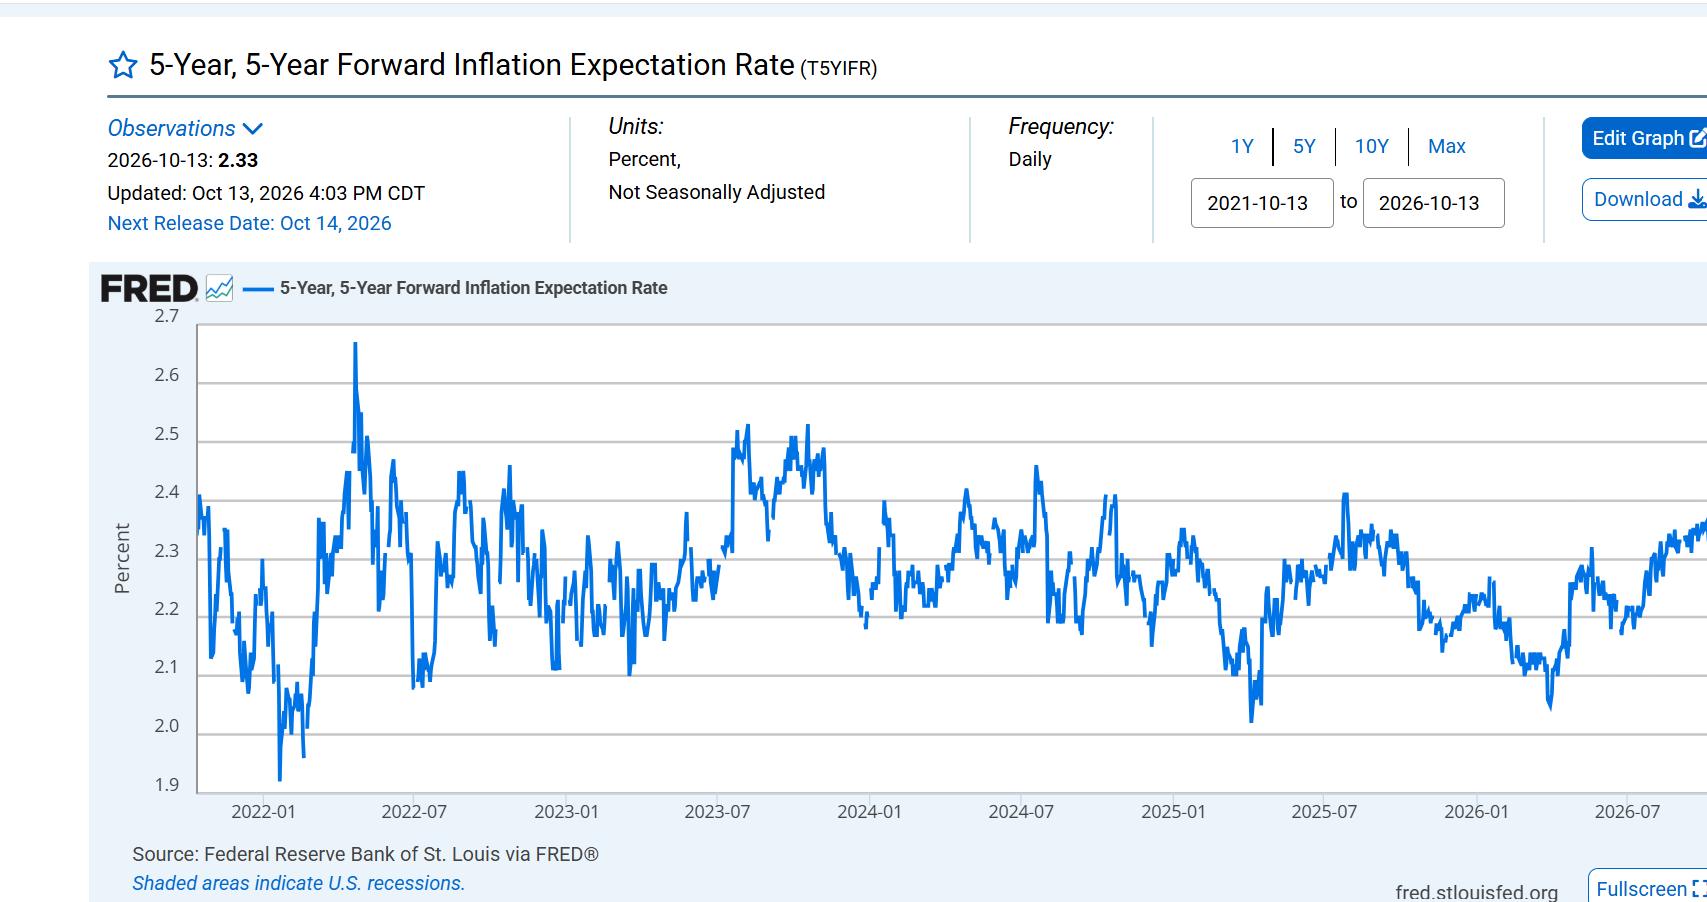
For a bit of macro context, the 5-year inflation forward rate sat at 2.33% on October 13. That tells us what the market thinks about inflation five years down the road, so don't try to use it as a tool to predict today's data.
At the end of the day, the Fed cares about PCE inflation, not just CPI. This single release isn't going to magically settle when the next rate cut or hike is happening. As traders, the smartest thing we can do today is ignore the initial algorithmic knee-jerk reaction. Wait to see if Treasury yields actually hold their initial moves, and check the underlying CPI details to see if this inflation story is strictly about energy, or if it's spreading back into the broader economy.
Author

Serhad Colak
Capital Insights
Serhad Colak is the founder of Capital Insights. His work focuses on macroeconomic research, monetary policy and cross-asset analysis, with particular attention to inflation, labor-market developments and interest-rate expectations.