BLS Reports Tame Inflation as Medical Costs Soar Out of Sight


Once again the BLS tells us inflation is under control. Once again, close inspection suggests something else.
Let's investigate, starting with the BLS Consumer Price Index Report for January 2020.
- According to the BLS, the Consumer Price Index for All Urban Consumers (CPI-U) rose 0.1 percent in January on a seasonally adjusted basis after rising 0.2 percent in December.
- The index for shelter accounted for the largest part of the increase in the seasonally adjusted all items index, with the indexes for food and for medical care services also rising. These increases more than offset a decrease in the gasoline index, which fell 1.6 percent in January.
- The index for all items less food and energy rose 0.2 percent in January after increasing 0.1 percent in December.
- The all items index increased 2.5 percent for the 12 months ending January, the largest 12-month increase since the period ending October 2018. The index for all items less food and energy rose 2.3 percent over the last 12 months, the same 12-month increase as reported in the previous 3 months. The food index rose 1.8 percent over the last 12 months, while the energy index increased 6.2 percent over that period.
CPI Month-Over-Month and Year-Over-Year

Hooray! Inflation Tame
Hooray, inflation as measured by the BLS is only up 2.3% from a year ago, the same as December.
Month-over-month, the CPI rose only 0.1% vs the expected 0.2%.
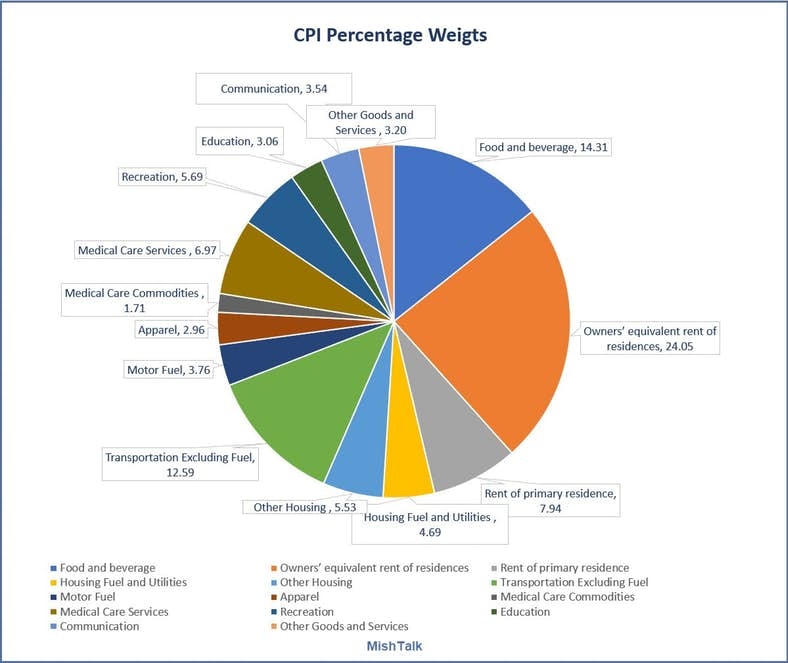
But does your basket match this?
CPI Percentage Weights

It's when you dig into details you find disturbing trends, like the lead chart and this.
Medical Care Costs Year-Over-Year

Medical Insurance Quotes
I posted these quotes last month, but it's worth another look after this gloomy report.
I went to NerdWallet for some quotes. My base case was a husband and wife making a combined $100,000, both aged 60, non-smokers, with no dependents.

Same Couple Making $60,000

Synopsis
- For a couple, aged 60, making $100,000 per year, "affordable" care costs $19,776 right off the top. Then there is a max out of pocket expense of $8,150 per person. Yes, per person.
- For a couple, aged 60, making $60,000 per year, "affordable" care costs $3,804 right off the top. Then there is a max out of pocket expense of $8,150 per person.
The BLS tells us, medical care is only 6.97% of the "average" household expense.
Average includes all those on medicaid and medicare. It also includes those on company plans.
It does not count corporate costs. Why? The BLS is only concerned with "consumer" prices. No other measures of inflation are important.
Averages take into consideration the average person does not go to the hospital.
Heaven help you if you actually need help.
What About Home Prices?
Good question, especially if you want to buy a house.
The BLS Relative Importance Table shows housing is 42.20% of the CPI.
Owners' Equivalent Rent is the largest component in the CPI, accounting for a whopping 24.05% of the CPI.
The Owners’ Equivalent Rent (OER) Calculation method is absurd.
The expenditure weight in the CPI market basket for Owners’ equivalent rent of primary residence (OER) is based on the following question that the Consumer Expenditure Survey asks of consumers who own their primary residence: “If someone were to rent your home today, how much do you think it would rent for monthly, unfurnished and without utilities?”
Home Prices vs OER vs Earnings

Already have a home?
If not, don't expect to find an affordable one. Sorry. You simply do not fit the BLS mode where averages rule.
BLS Model vs Reality
If you are in school, looking to buy a home, buying your own health care, or even having insurance but getting sick, then your measure of the CPI will be dramatically different than what the BLS tells you.
If you are 65, on Medicare, and own your own home. Congratulations. You fit the BLS CPI mold perfectly!
Author

Mike “Mish” Shedlock's
Sitka Pacific Capital Management,Llc


