- AUD/USD regained the smile and bounced off lows near 0.6530.
- Fresh selling pressure on the US Dollar allowed the recovery in risky assets.
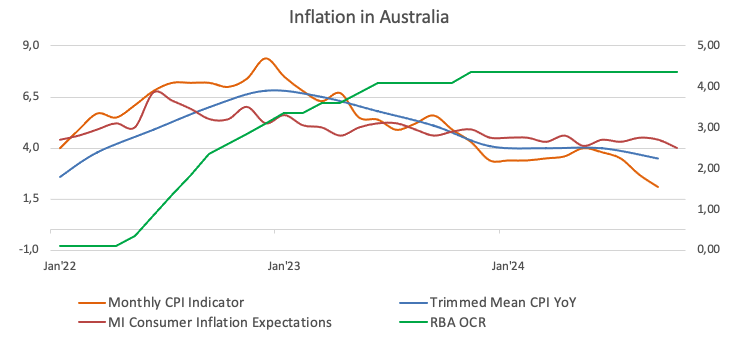
- Australian inflation figures showed further loss of momentum.
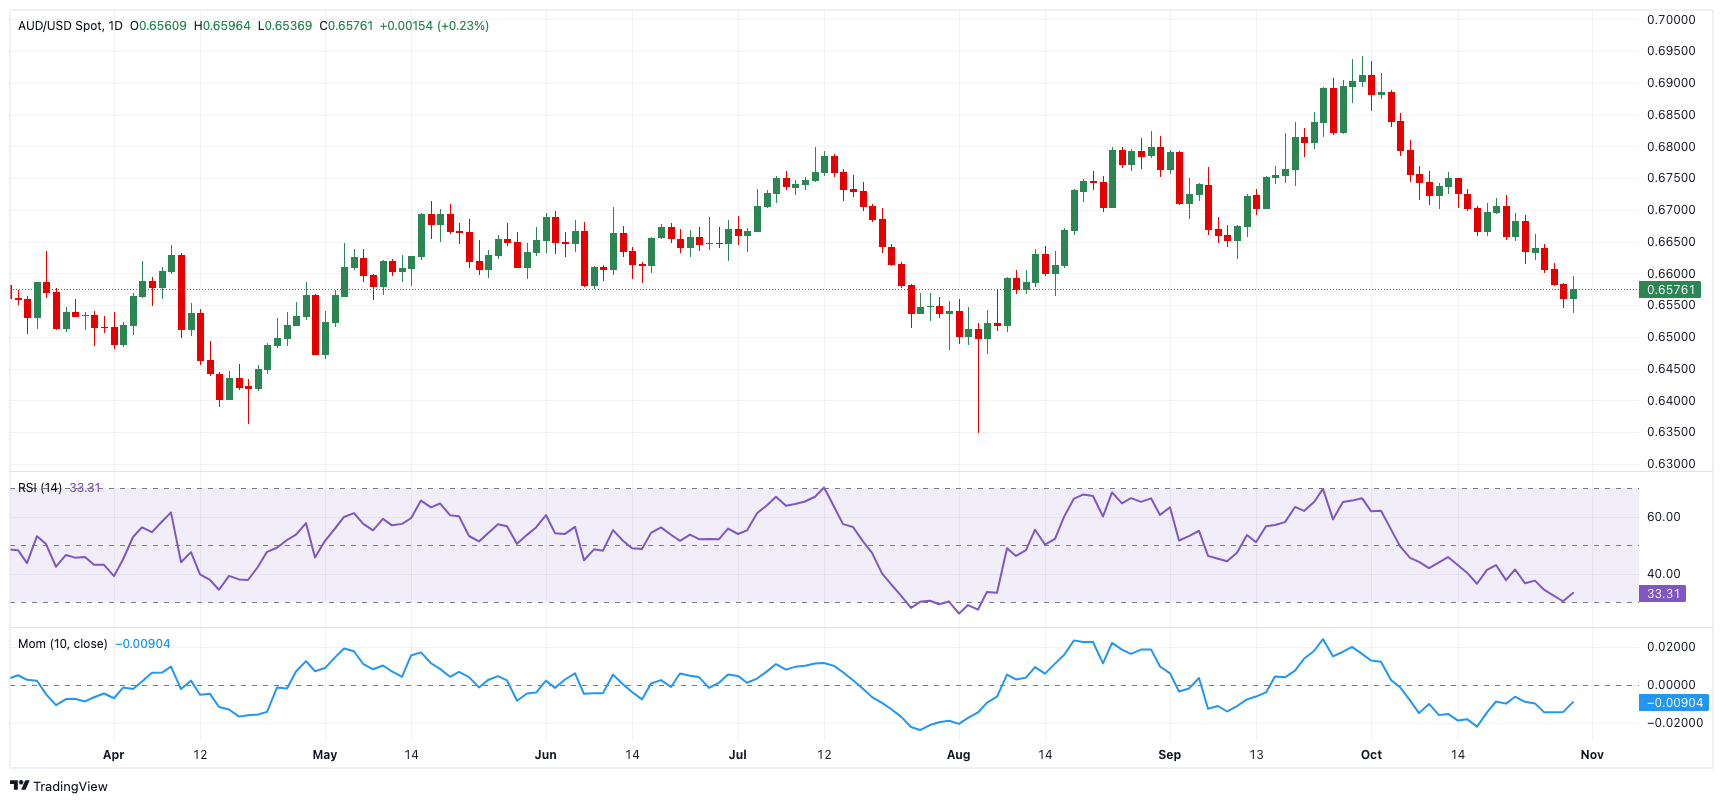
After three consecutive daily declines, AUD/USD met some fresh upside impulse on Wednesday, printing decent gains and climbing to as high as the boundaries of 0.6600 the figure.
This rebound allowed the pair to refocus its target on the critical 200-day simple moving average (SMA), currently at 0.6627. Above this region, the pair’s outlook is expected to shift to a more constructive one.
The Australian Dollar’s (AUD) rebound from multi-week lows in the 0.6540-0.6535 band came amidst extra weakness in the US Dollar (USD), which sponsored a decent recovery in most risk-sensitive assets.
Beyond USD-selling, the AUD’s bounce came despite ongoing doubts over the effectiveness of China’s stimulus measures announced earlier in the month.
A knee-jerk in copper prices, in the meantime, coupled with marginal price action around iron ore prices, reflected the market's mixed sentiment on China’s economic outlook.
On the policy front, the Reserve Bank of Australia (RBA) held its cash rate steady at 4.35% at its September meeting. Governor Michele Bullock acknowledged persistent inflation risks but downplayed the likelihood of an imminent rate hike.
The meeting minutes indicated a more cautious tone than in August, signalling that interest rates might stay steady for the foreseeable future. Current market sentiment points to a 50% probability of a 25-basis-point rate cut by year-end. The RBA is expected to be one of the last G10 central banks to lower rates as growth and inflation gradually ease.
However, Deputy Governor Andrew Hauser recently cautioned against overly optimistic expectations for substantial RBA rate cuts, noting that the neutral rate range of 3% to 4% suggests the current 4.35% rate is not overly restrictive.
While potential rate cuts by the Federal Reserve later this year could provide some support for AUD/USD, persistent uncertainty around China’s economic direction is likely to maintain downward pressure on the pair.
Recent data from Australia showed the RBA’s Monthly CPI Indicator increasing by 2.1% in September, down from 2.7%. Meanwhile, the Inflation Rate rose by 2.8% YoY in the third quarter, and the RBA’s Trimmed Mean CPI advanced by 3.5% from a year earlier, a decrease from 4.0%. Although disinflationary pressures are building, they may not be sufficient for the central bank to initiate its easing cycle just yet.
AUD/USD daily chart
AUD/USD short-term technical outlook
Extra losses might bring the AUD/USD to its October low of 0.6536 (October 30), ahead of the 2024 bottom of 0.6347 (August 5).
On the upside, there is intermediate resistance at the 200-day SMA of 0.6627, followed by the interim 100-day and 55-day SMAs of 0.6693 and 0.6738, respectively, before hitting the 2024 top of 0.6942 (September 30).
The four-hour chart shows a mild reversal in the ongoing negative trend. The initial support is at 0.6536, followed by 0.6347. On the upswing, the initial resistance level is the 55-SMA at 0.6635, then the 100-SMA at 0.6672, and finally 0.6723. The RSI rose to nearly 44.
Information on these pages contains forward-looking statements that involve risks and uncertainties. Markets and instruments profiled on this page are for informational purposes only and should not in any way come across as a recommendation to buy or sell in these assets. You should do your own thorough research before making any investment decisions. FXStreet does not in any way guarantee that this information is free from mistakes, errors, or material misstatements. It also does not guarantee that this information is of a timely nature. Investing in Open Markets involves a great deal of risk, including the loss of all or a portion of your investment, as well as emotional distress. All risks, losses and costs associated with investing, including total loss of principal, are your responsibility. The views and opinions expressed in this article are those of the authors and do not necessarily reflect the official policy or position of FXStreet nor its advertisers. The author will not be held responsible for information that is found at the end of links posted on this page.
If not otherwise explicitly mentioned in the body of the article, at the time of writing, the author has no position in any stock mentioned in this article and no business relationship with any company mentioned. The author has not received compensation for writing this article, other than from FXStreet.
FXStreet and the author do not provide personalized recommendations. The author makes no representations as to the accuracy, completeness, or suitability of this information. FXStreet and the author will not be liable for any errors, omissions or any losses, injuries or damages arising from this information and its display or use. Errors and omissions excepted.
The author and FXStreet are not registered investment advisors and nothing in this article is intended to be investment advice.
Recommended Content
Editors’ Picks

EUR/USD stays near 1.0400 in thin holiday trading
EUR/USD trades with mild losses near 1.0400 on Tuesday. The expectation that the US Federal Reserve will deliver fewer rate cuts in 2025 provides some support for the US Dollar. Trading volumes are likely to remain low heading into the Christmas break.

GBP/USD struggles to find direction, holds steady near 1.2550
GBP/USD consolidates in a range at around 1.2550 on Tuesday after closing in negative territory on Monday. The US Dollar preserves its strength and makes it difficult for the pair to gain traction as trading conditions thin out on Christmas Eve.

Gold holds above $2,600, bulls non-committed on hawkish Fed outlook
Gold trades in a narrow channel above $2,600 on Tuesday, albeit lacking strong follow-through buying. Geopolitical tensions and trade war fears lend support to the safe-haven XAU/USD, while the Fed’s hawkish shift acts as a tailwind for the USD and caps the precious metal.

IRS says crypto staking should be taxed in response to lawsuit
In a filing on Monday, the US International Revenue Service stated that the rewards gotten from staking cryptocurrencies should be taxed, responding to a lawsuit from couple Joshua and Jessica Jarrett.

2025 outlook: What is next for developed economies and currencies?
As the door closes in 2024, and while the year feels like it has passed in the blink of an eye, a lot has happened. If I had to summarise it all in four words, it would be: ‘a year of surprises’.

Best Forex Brokers with Low Spreads
VERIFIED Low spreads are crucial for reducing trading costs. Explore top Forex brokers offering competitive spreads and high leverage. Compare options for EUR/USD, GBP/USD, USD/JPY, and Gold.

