Dispelling Trading Myths Around Forex
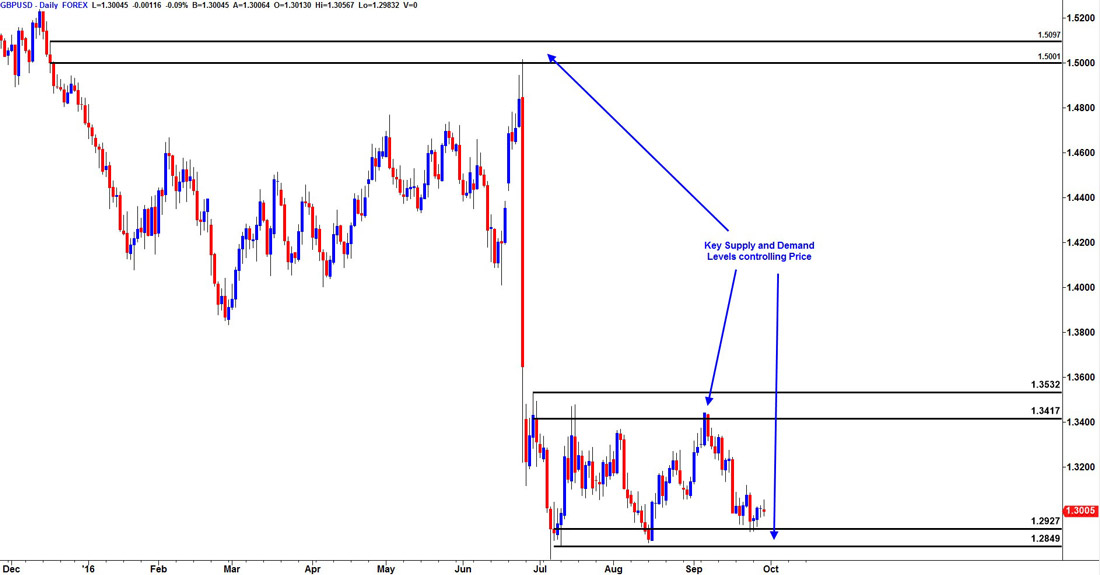
The professional trader simply knows how to look through the noise of the media and technical chart patterns to see where the biggest market players are entering into positions.
 SPECIAL
Chart patterns are one of the most effective trading tools for a trader. They are pure price-action, and form on the basis of underlying buying and selling pressure. Chart patterns have a proven track-record, and traders use them to identify continuation or reversal signals, to open positions and identify price targets.
As can be seen, these chart patterns might help you determine trend direction, but you should not rely solely on them.


Chart patterns are specific price formations on a chart that predict future price movements. As technical analysis is based on the assumption that history repeats itself, popular chart patterns have shown that a specific price movement is following a particular formation of price (chart pattern) with high probability. Therefore, chart pattners are grouped into (1) continuation patterns – that signal a continuation in the underlying trend, and (2) reversal patterns – that signal reversal of the underlying trend.
Continuation patterns are as important as reversal patterns. They are more suitable for a different style of trading- trend following. While reversal patterns are good for contrarian traders and swing traders, continuation patterns are considered to be great for finding a good entry point to follow the trend.
Head and Shoulders is a reversal chart pattern, that indicates the underlying trend is about to change. It consists of three swing highs, with the middle swing high being the highest (red lines on the chart). After the middle swing high, a lower high occurs which signals that buyers didn’t have enough strength to pull the price higher.
The professional trader simply knows how to look through the noise of the media and technical chart patterns to see where the biggest market players are entering into positions.
Since beginning my trading career I have encountered many ups and downs along the way attempting to discover how the financial markets really work.