ZN Elliott Wave analysis – Trading US 10-Yr from extreme

Hello traders. In this blog post, we will examine the US 10-Yr US Treasury Note – ZN Elliott Wave Analysis. We will identify how it bounced from an extreme area, presenting a bullish opportunity for traders. Additionally, for educational purposes, we will explore the near future path.
The 10-Year Treasury Note futures, often referred to as “10-Year T-Note futures,” with ticker ZN_F, are financial contracts that derive their value from the anticipated price of U.S. 10-Year Treasury Notes. These futures are among the most actively traded fixed-income products and play a crucial role in the global financial market.
In the medium term, we anticipate that $ZN_F could develop into a double zigzag structure from the low of October 2023 in the cycle degree. From that low, wave W of the double zigzag began and ended in the high of December 2023, where wave X started. Wave X concluded on April 25, 2024, followed by the start of wave Y. By projection, wave Y should potentially break above the December 2023 high where wave W ended. With this in mind, we started updating 1-hour charts for elliottwave-forecast.com members from the low of April 25, 2024. In the near term, a bullish sequence emerged from the April 2024 low. We identified this sequence as an impulse wave completing wave (1) of ((A)) of Y.
ZN Elliott Wave analysis – 13th May 2024 update
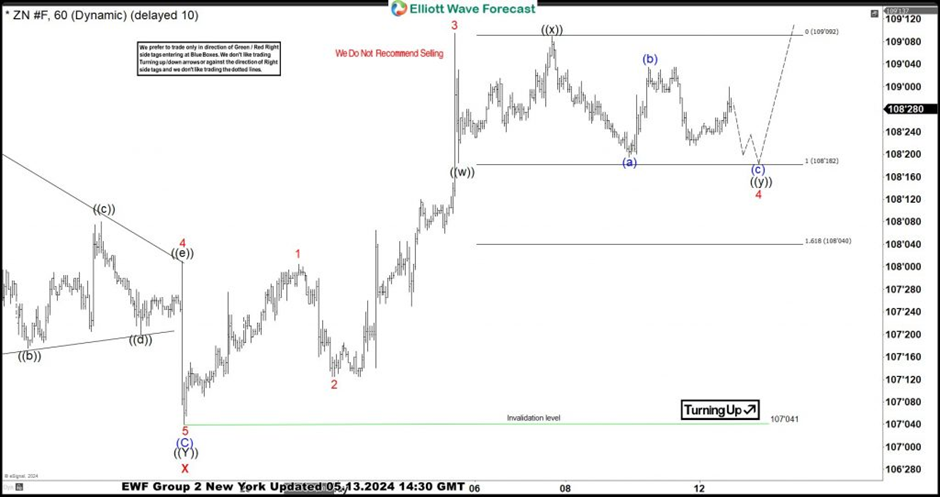
The chart above shows the analysis we shared with members on May 13, 2024. On the chart, we identified the end of wave 3 at the peak of May 3. Meanwhile, our attention was on the wave 4 correction, expected to find support near the 108’182 to 108’040 extreme. We anticipated wave 4 to find support at this extreme, followed by a wave 5 rally. Therefore, we alerted members to watch for price resurgence from this extreme.
ZN Elliott Wave analysis – 15th May 2024 update
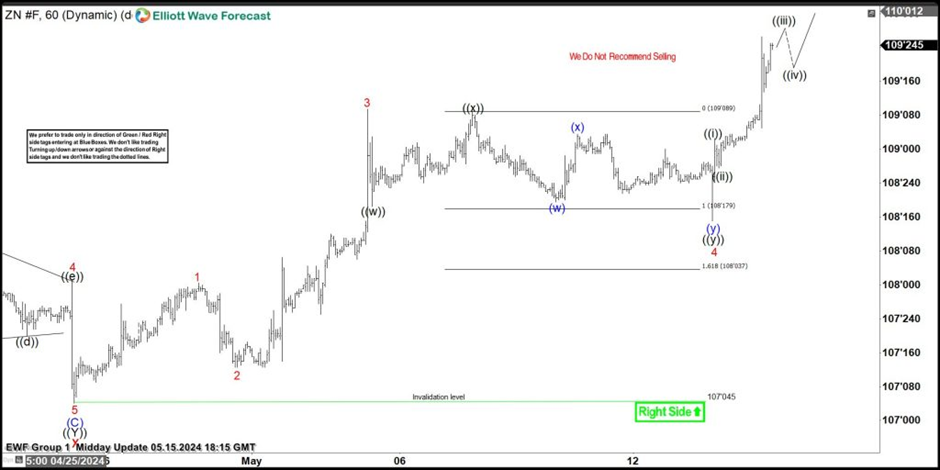
Price did just as expected, dropping slightly below the equal leg of approximately 108’18 before surging rapidly. Afterward, we shared the updated chart on May 15, 2024, highlighting wave 5. Wave 5 emerged as an impulse. We expected price to complete the impulse before a deeper correction followed. This was precisely what happened, as the chart below shows.
ZN Elliott Wave analysis – 20th May 2024 update
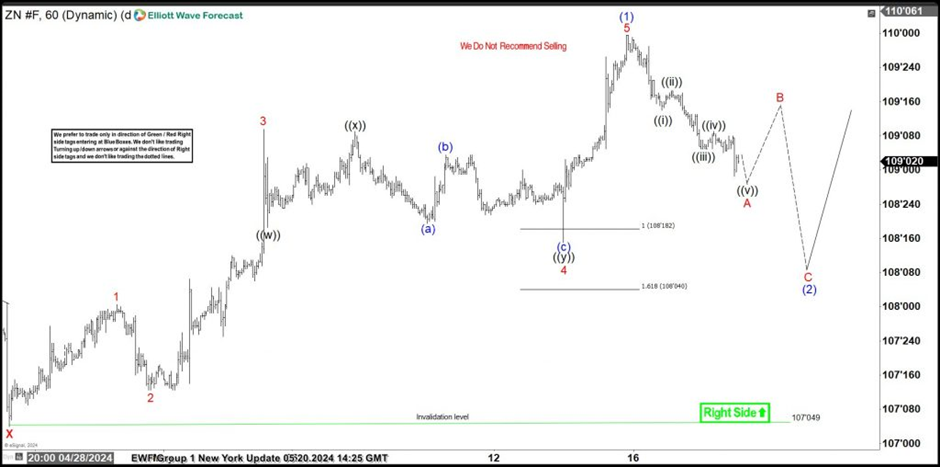
Price completed wave 5 of (1) and started correcting in wave (2). Currently, as the May 20 New York update shows, the wave (2) correction is underway. The next LONG opportunity will be for wave (3) after wave (2) concludes. Therefore, we will monitor this through either a 3, 7, or 11 swing correction for wave (2). Members can rely on our regular timed updates for the Elliott Wave path across all time frames for 78 instruments.
Meanwhile, members receive hourly updates four times a day and can use our forecasts as guides for their trading strategies. On each chart, we indicate the trading direction to consider. In the live trading room, members have access to trade signals and trade management guides. Additionally, members can chat with our analysts 24 hours a day from Monday to Friday.
Author

Elliott Wave Forecast Team
ElliottWave-Forecast.com


