|

XLY responding higher from the Elliott Wave blue box area

In this technical blog, we will look at the past performance of the 1-hour Elliott Wave Charts of XLY We presented to members at the elliottwave-forecast. In which, the rally from the 23 October 2024 low unfolded as an impulse structure. Also showed a higher high sequence with a bullish sequence stamp. Suggested that ETF should see more upside extension to complete the impulse sequence. Therefore, we advised members not to sell the ETF & buy the dips in 3, 7, or 11 swings at the blue box areas. We will explain the structure & forecast below:

XLY one-hour Elliott Wave chart from 11.15.2024

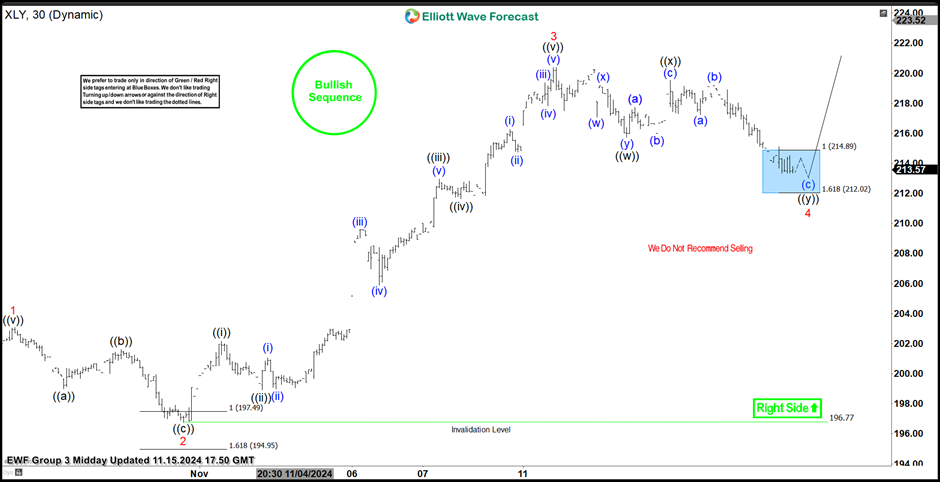
Here’s the 1-hour Elliott wave chart from the 11.15.2024 Midday update. In which, the short-term cycle from the 10.31.2024 low ended in wave 3 as impulse at $220.39 high. Down from there, the ETF made a pullback in wave 4 to correct that cycle. The internals of that pullback unfolded as Elliott wave double three structure where wave ((w)) ended at $215.75 low. Wave ((x)) bounce ended at $219.54 high. Then wave ((y)) managed to reach the blue box area at $214.89- $212.02. From there, buyers were expected to appear looking for the next leg higher or for a 3 wave bounce minimum.

XLY latest one-hour Elliott Wave chart from 11.19.2024

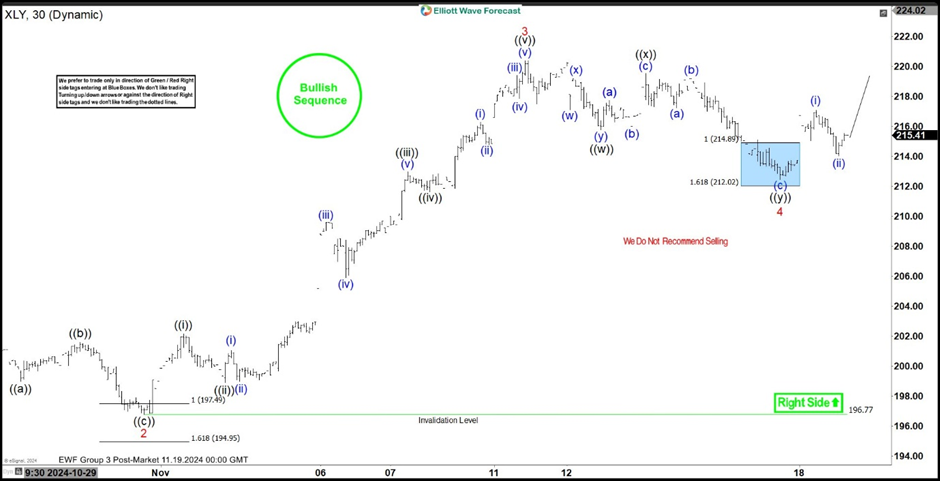
This is the latest 1-hour Elliott wave Chart from the 11.19.2024 Post-Market update. In which the ETF is showing a reaction higher taking place, right after ending the double correction within the blue box area. Allowed members to create a risk-free position shortly after taking the long position at the blue box area. However, a break above $220.39 high is yet to be seen to confirm the next extension higher in wave 5 towards minimum extension target at $222.30- $225.35.

Author

Elliott Wave Forecast Team

Elliott Wave Forecast Team

ElliottWave-Forecast.com

More from Elliott Wave Forecast Team
Share:

Editor's Picks

EUR/USD tests nine-day EMA support near 1.1850

EUR/USD remains in the negative territory for the fourth successive session, trading around 1.1870 during the Asian hours on Friday. The 14-day Relative Strength Index momentum indicator at 56 stays above the midline, confirming steady momentum. RSI has eased but remains above 50, indicating momentum remains constructive for the bulls.

GBP/USD consolidates around 1.3600 vs. USD; looks to US CPI for fresh impetus

The GBP/USD pair remains on the defensive through the Asian session on Friday, though it lacks bearish conviction and holds above the 1.3600 mark as traders await the release of the US consumer inflation figures before placing directional bets.

Gold: Will US CPI data trigger a range breakout?

Gold retakes $5,000 early Friday amid a turnaround from weekly lows as US CPI data loom. The US Dollar consolidates weekly losses as AI concerns-driven risk-off mood stalls downside. Technically, Gold appears primed for a big range breakout, with risks skewed toward a bullish break.

Bitcoin, Ethereum and Ripple stay weak as bearish momentum persists

Bitcoin, Ethereum and Ripple remain under pressure, extending losses of over 5%, 6% and 4%, respectively, so far this week. BTC trades below $67,000 while ETH and XRP correct after facing rejection around key levels. With bearish momentum persisting and prices staying weak, the top three cryptocurrencies continue to show no clear signs of a sustained recovery.

A tale of two labour markets: Headline strength masks underlying weakness

Undoubtedly, yesterday’s delayed US January jobs report delivered a strong headline – one that surpassed most estimates. However, optimism quickly faded amid sobering benchmark revisions.

Aster Price Forecast: Demand sparks on Binance Wallet partnership for on-chain perpetuals

Aster is up roughly 9% so far on Thursday, hinting at the breakout of a crucial resistance level. Aster partners up with Binance wallet for the second season of the on-chain perpetuals challenge.