XLY Elliott Wave rally call: Near-perfect setup, missed entry

As many of you know, we’ve had many profitable trading setups recently, some of which we’ve shared in previous blogs and on StockTwits and Twitter. In this technical article, we’re going to present something a bit different—an Elliott Wave setup that almost hit our entry point, missing it by just 0.67 points. We are going to talk about the XLY trading setup presented to members of ElliottWave-Forecast.
Recently, XLY experienced a 3-wave pullback, unfolding as an Elliott Wave Double Three pattern. We identified and shared the Blue Box – our buying zone – with our members, but unfortunately, the pullback ended just shy of our ideal entry.
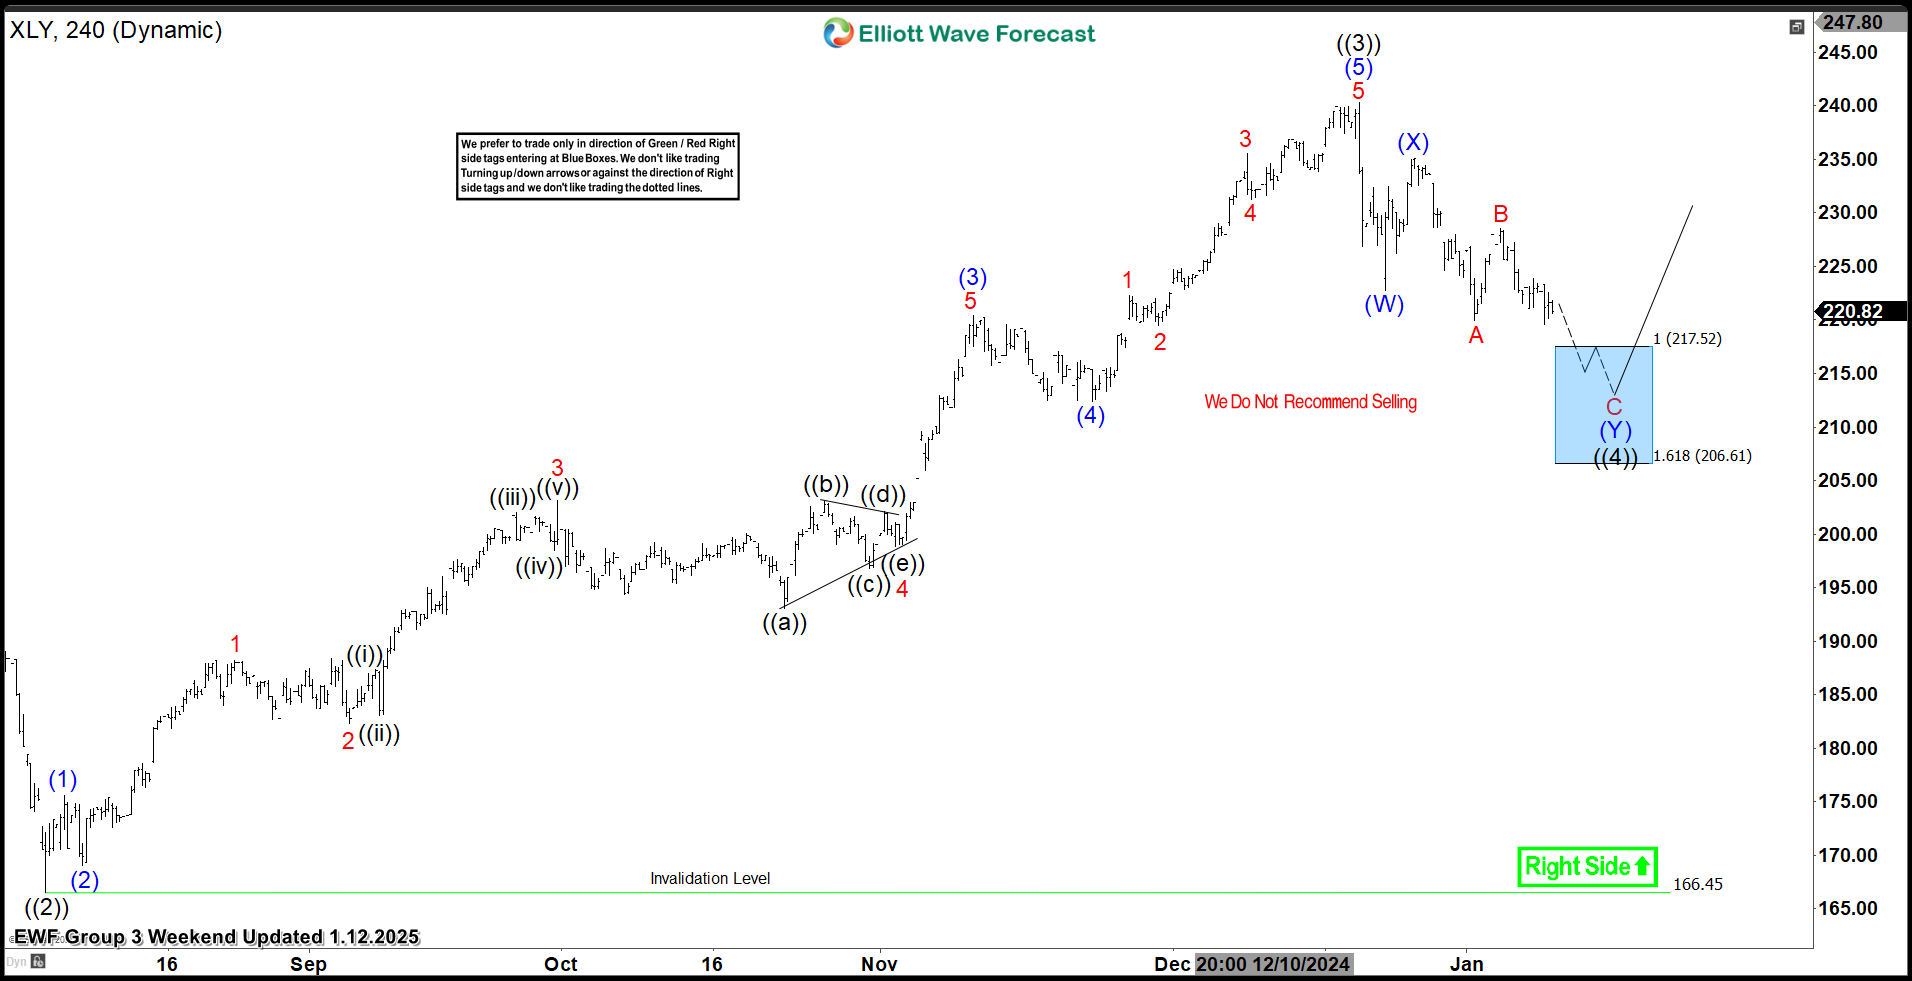
XLY Elliott Wave four-hour chart 01.12.2025
The current view shows that XLY is forming a wave ((4)) black correction. The price action shows an incomplete 5-swing decline from the peak, suggesting there is still another leg down. This correction is likely unfolding as an Elliott Wave Double Three pattern. We expect an extension toward the 217.52-206.61 area, where we plan to re-enter as buyers.
We recommend members avoid selling XLY, as the main trend remains bullish. XLY should see at least a 3-wave bounce from this Blue Box area. Once the price touches the 50% Fibonacci level against the ((b)) black connector, we’ll make positions risk-free, set the stop loss at breakeven, and book partial profits. If the price breaks below the 1.618 Fibonacci extension level at 206.61, the trade will be invalid.
Official trading strategy on How to trade 3, 7, or 11 swing and equal leg is explained in details in Educational Video, available for members viewing inside the membership area.
90% of traders fail because they don’t understand market patterns. Are you in the top 10%? Test yourself with this advanced Elliott Wave Test
Quick reminder on how to trade our charts :
Red bearish stamp+ blue box = Selling Setup
Green bullish stamp+ blue box = Buying Setup
Charts with Black stamps are not tradable.
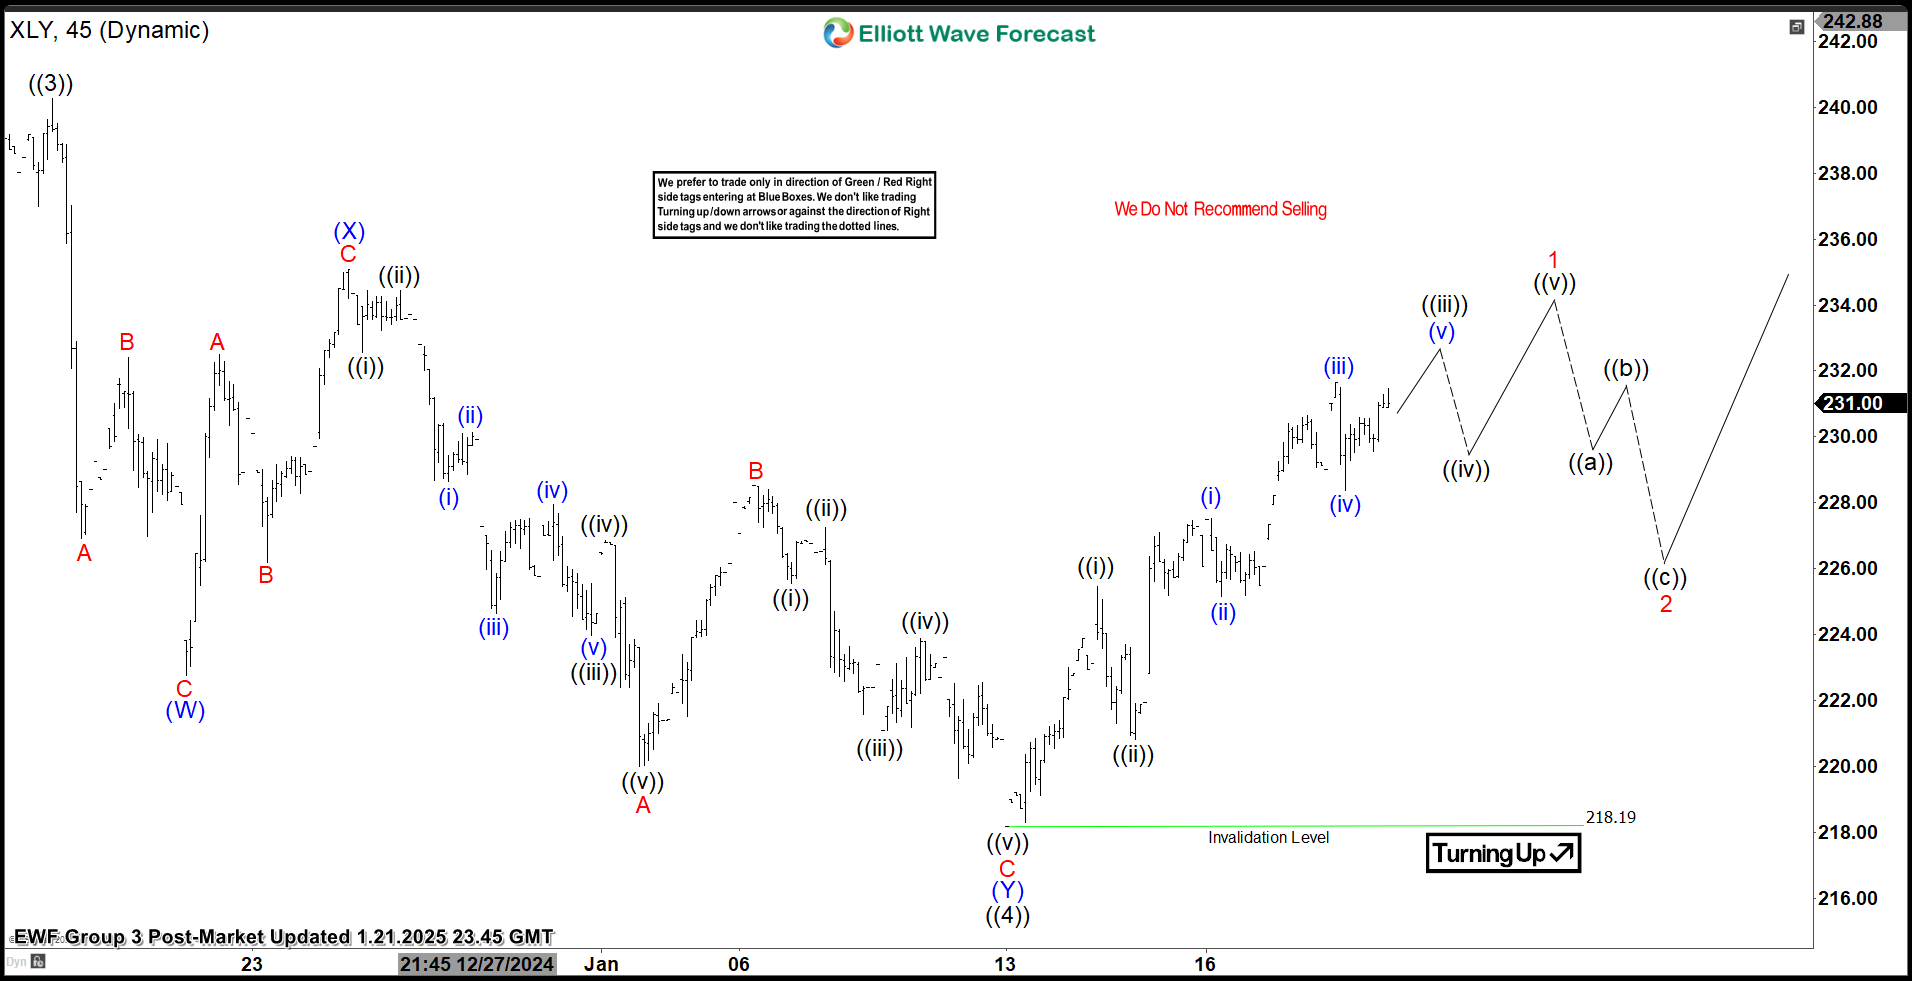
XLY Elliott Wave one-hour chart 01.21.2025
At the downgraded chart below, we can see that the pullback indeed formed a Double Three pattern. Unfortunately, the price ended the pullback as a truncation. Our entry area was 217.52, but the correction completed early at 218.19, missing our entry by just 0.67 points. As we always say, not every trading setup will work out perfectly. This is a regular part of trading and should be accepted. In such cases, we simply move on – there will always be plenty of good trading setups ahead. The current view suggests that the ETF is forming a 5-wave pattern from the 218.19 low. This is a crucial level to hold for the proposed view.
Author

Elliott Wave Forecast Team
ElliottWave-Forecast.com


