XLV made reaction from the blue box (buying zone)

In this technical blog we’re going to take a quick look at the Elliott Wave charts of XLV ETF, published in members area of the website. As our members know we have been favoring the long side in XLV. The ETF is bullish against the 137.21 pivot. Recently we got a pull back that has made a clear 3 waves pull back that found buyers right at the Blue Box area. In the further text we are going to explain the Elliott Wave forecast and trading strategy.
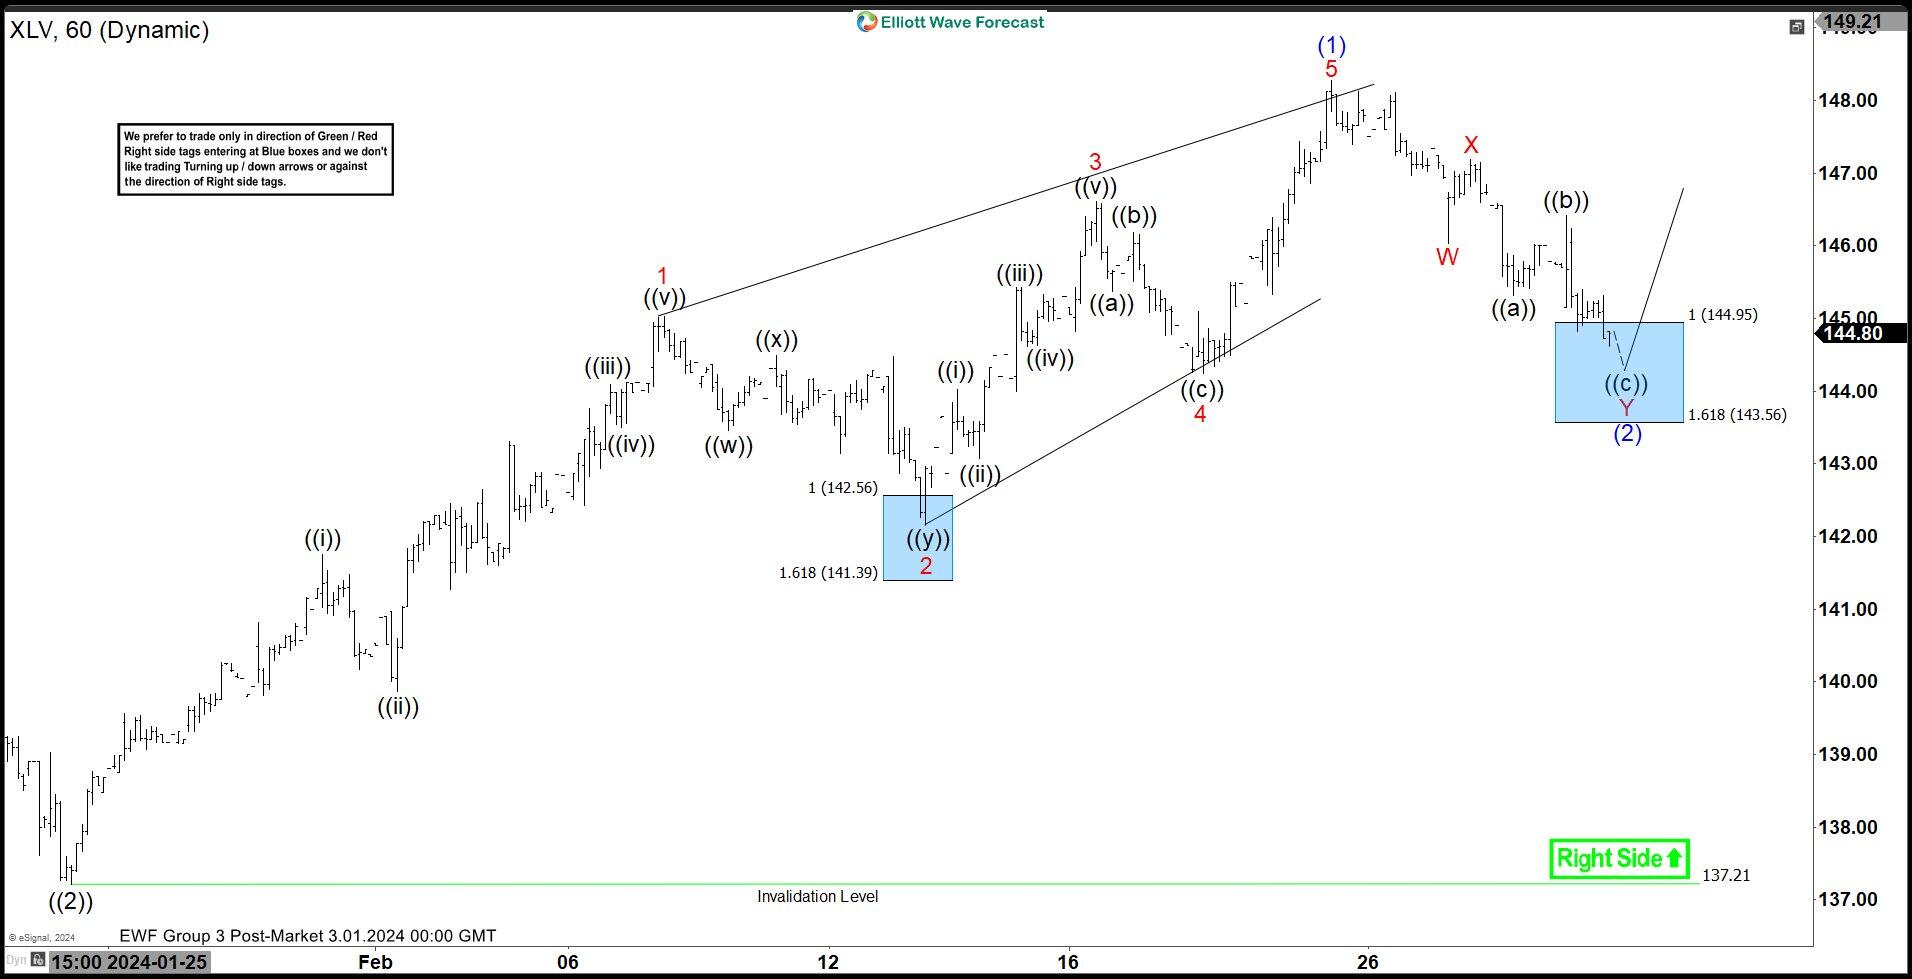
XLV Elliott Wave one hour chart 03.01.2024
XLV is giving us wave (2) pull back that is unfolding as Double Three pattern. Pull back has already reached extreme zone from the peak. We expect ETF to find buyers at 144.95-143.56 area for further rally toward new highs or for a 3 waves bounce at least. We don’t recommend selling XLV against the main bullish trend. Strategy is buying the dips at the marked extreme zone : 144.95-143.56 . Once bounce reaches 50 Fibs against the X red high , we will make long position risk free and take partial profits. Invalidation for the long trades is break of 1.618 fib ext : 143.56.
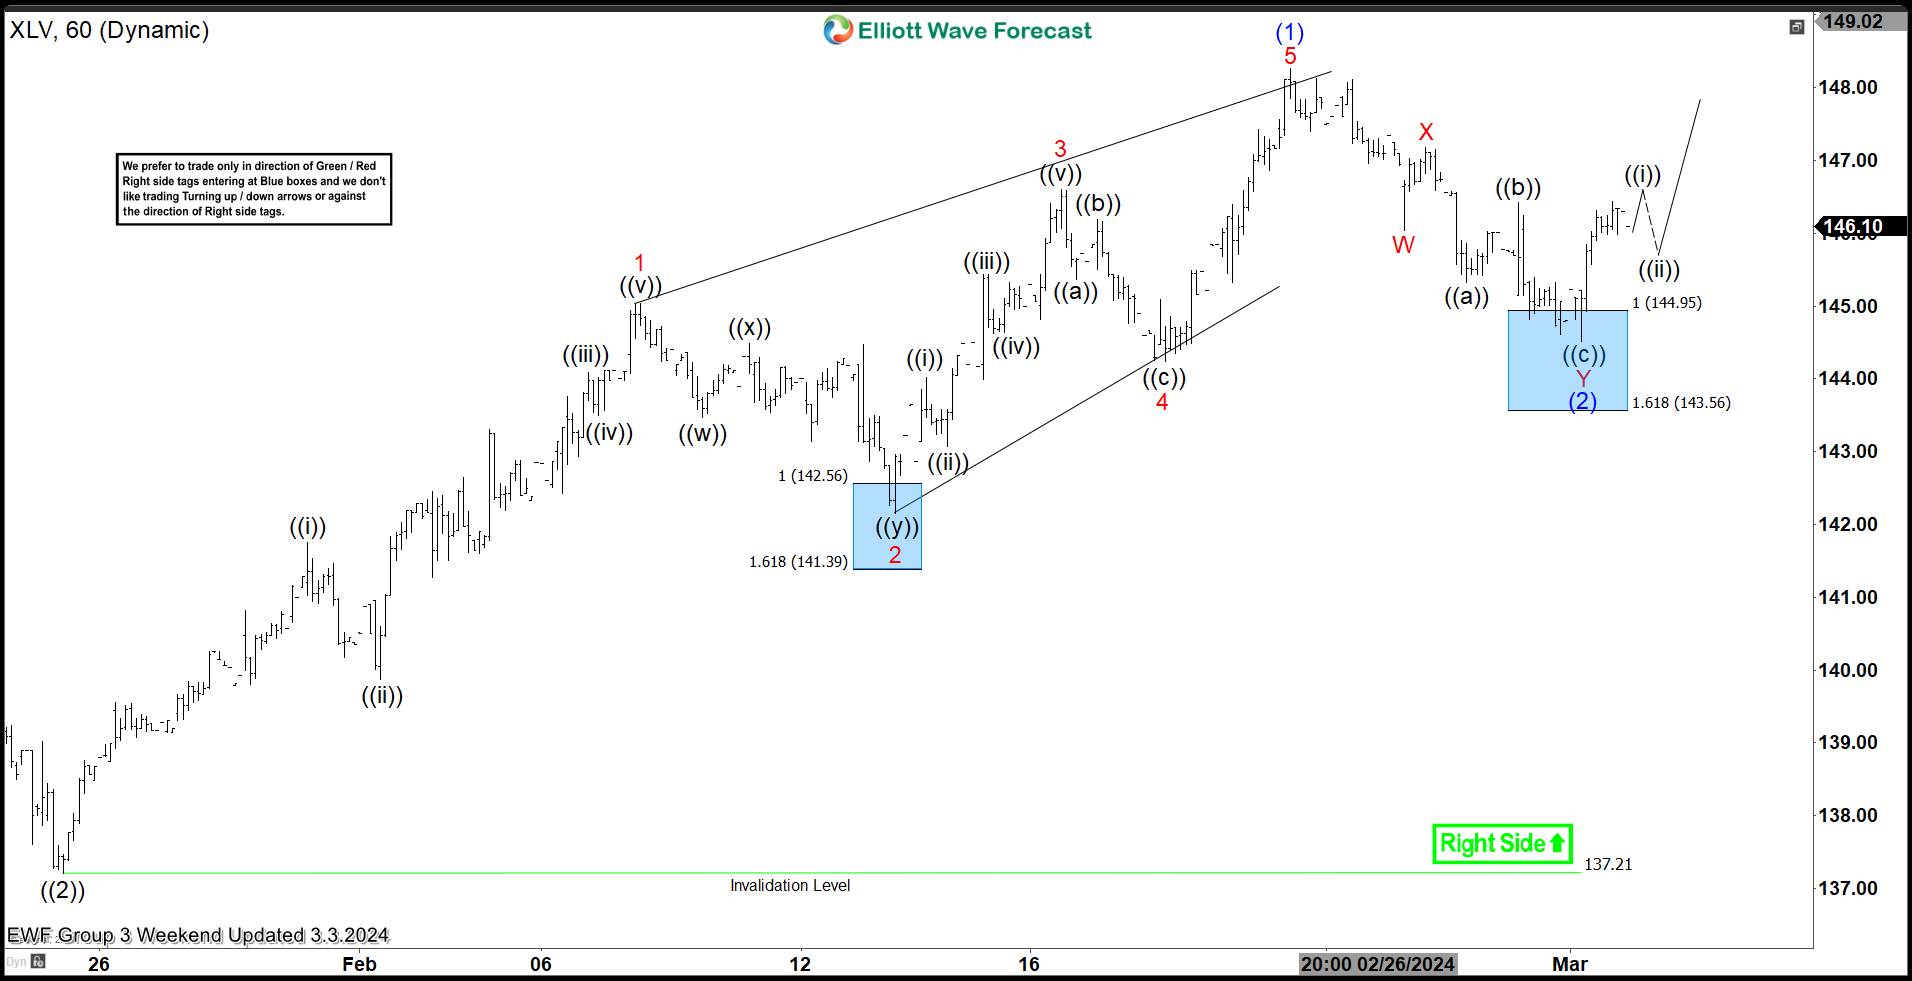
XLV Elliott Wave one hour chart 03.03.2024
XLV found buyers at the blue box and we got good reaction as expected. Pull back completed as Elliott Wave Double Three Pattern. Bounce reached and exceeded 50 fibs against the X red connector which confirms cycle from the peak is done. Consequently, any long positions from the equal legs area should be risk free by now. We count wave (2) pull back completed at the 144.56 low. However ,we still need to see break above (1) blue peak to confirm next leg up is in progress. As far as the price holds above 144.56 low, we expect to see further strength. Otherwise, break of 144.56 low would make incomplete lower low sequences from the peak and open possibility of extension down within the pull back.
Author

Elliott Wave Forecast Team
ElliottWave-Forecast.com


