XLV Elliott Wave : Double reaction from equal legs zone

In this technical article we’re going to look at the Elliott Wave charts of XLV ETF published in members area of the website. As our members know, XLV is showing incomplete bearish sequences in the cycle from the 159.64 peak (August high). The price structure indicated further weakness, targeting 126.53-120.91. In the following text, we will provide a more detailed explanation of the Elliott Wave forecast.
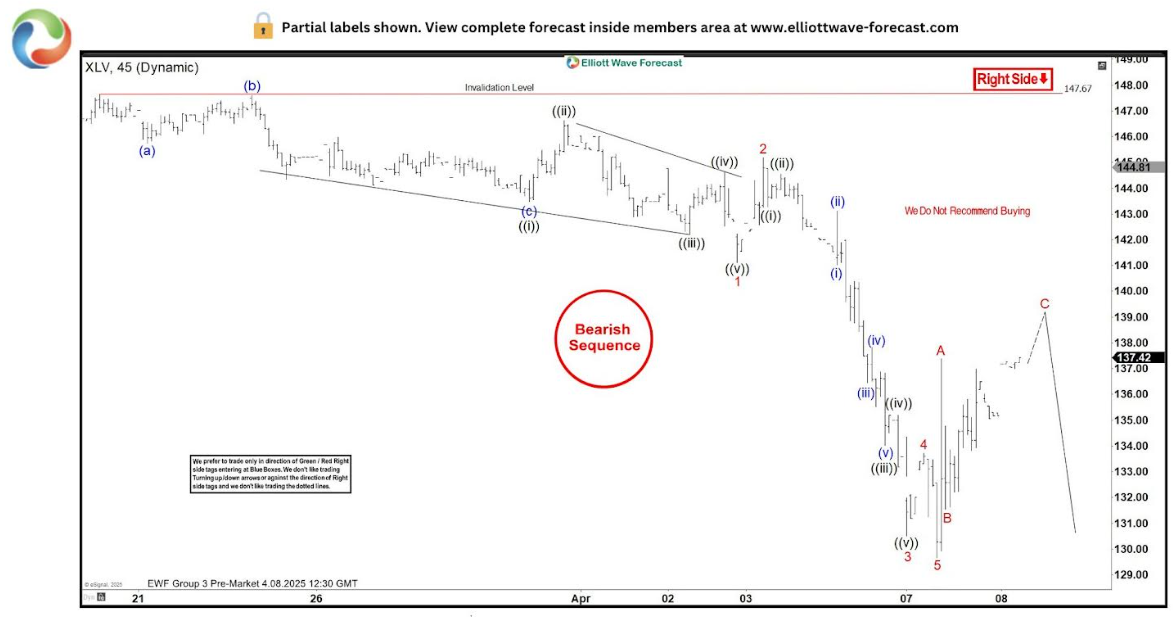
XLV Elliott Wave one-hour chart 04.08.2025
The ETF calls for more weakness due to lower low sequences in the cycle from the 159.65 peak. XLV is targeting the 126.53–120.91 area. We anticipate a further drop as long as the pivot at 147.67 holds. The current view suggests XLV is giving us a 3-wave recovery (ABC in red), which could complete around the 139.26-141.1 area (equal legs A-B in red). We do not recommend buying at this stage and continue to favor the short side.
Important : 90% of traders fail because they don’t understand market patterns. Are you in the top 10%? Test yourself with this advanced Elliott Wave Test.
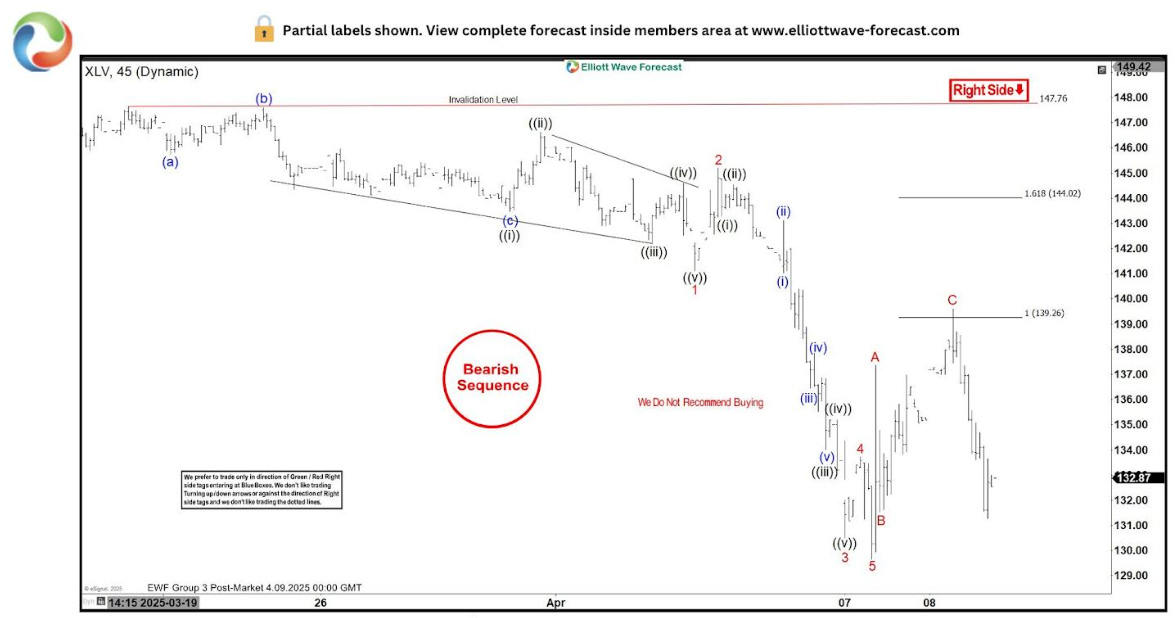
XLV Elliott Wave one-hour chart 04.09.2025
XLV found sellers as expected and made the nice reaction from the sellers zone . We would like to see break down of the low and continuation of the bearish cycle.
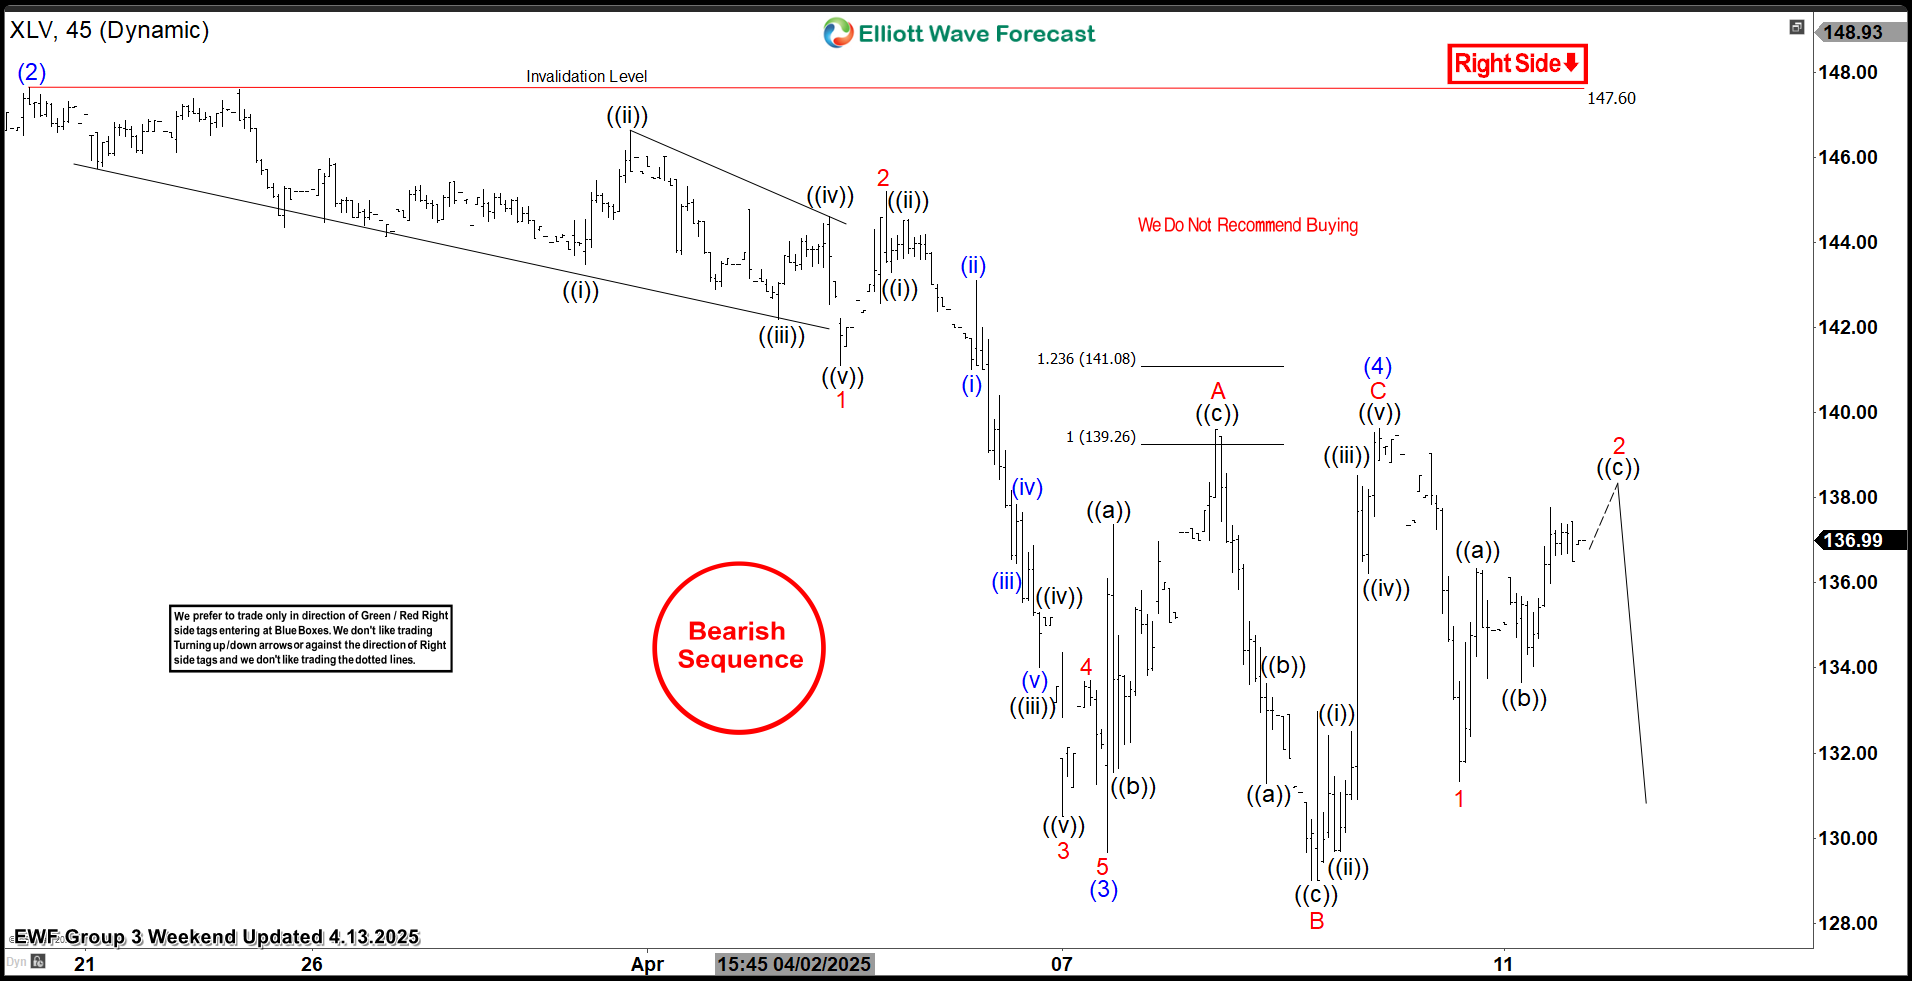
XLV Elliott Wave one-hour chart 04.09.2025
XLV continued trading lower, made break of previous low and make sharp turn. This type of moves are tipical for Elliott Wave Flat patternst, when first 2 legs A and B are corrective and wave C is impulsive. The price reached extreme zone again, and reacted lower. While below 139.46 peak we can consider (4) blue recovery completed, looking for another low to complete the cycle.
Author

Elliott Wave Forecast Team
ElliottWave-Forecast.com


