|

XLF into the new highs after reaching blue box area

In this technical blog, we will look at the past performance of the 1-hour Elliott Wave Charts of XLF. In which, the rally from the 05 August 2024 low unfolded as an impulse structure and showed a higher high sequence. Suggested that ETF should see more upside extension to complete the impulse sequence. Therefore, we advised members not to sell the ETF & buy the dips in 3, 7, or 11 swings at the blue box areas. We will explain the structure & forecast below:

XLF one-hour Elliott Wave chart from 10.31.2024

Chart

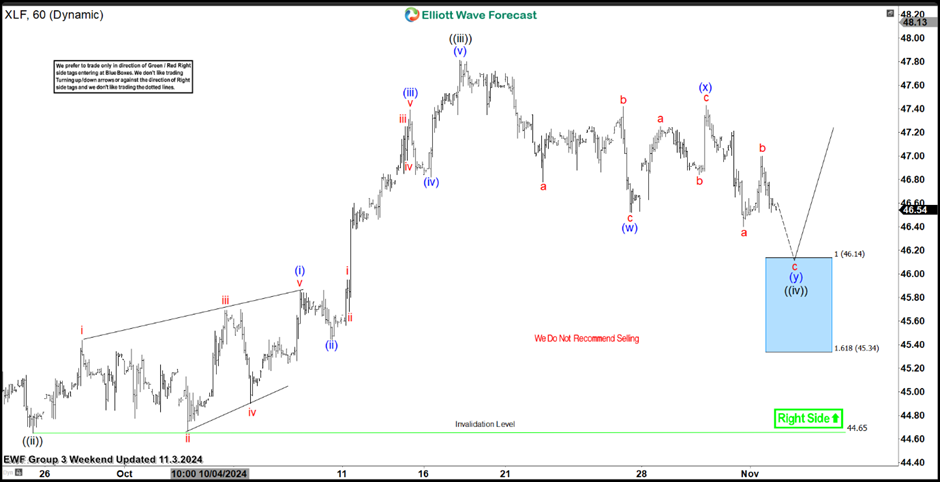
Here’s the 1-hour Elliott wave chart of XLF from the 10.31.2024 Midday update. In which, the short-term cycle from the 9.25.2024 low ended in wave ((iii)) as impulse at $47.81 high. Down from there, the ETF made a pullback in wave ((iv)) to correct that cycle. The internals of that pullback unfolded as Elliott wave double three structure where wave (w) ended at $46.52 low. Wave (x) bounce ended at $47.43 high and wave (y) managed to reach the blue box area at $46.14- $45.34. From there, buyers were expected to appear looking for the next leg higher or for a 3 wave bounce minimum.

XLF latest one-hour Elliott Wave chart from 11.12.2024

Chart

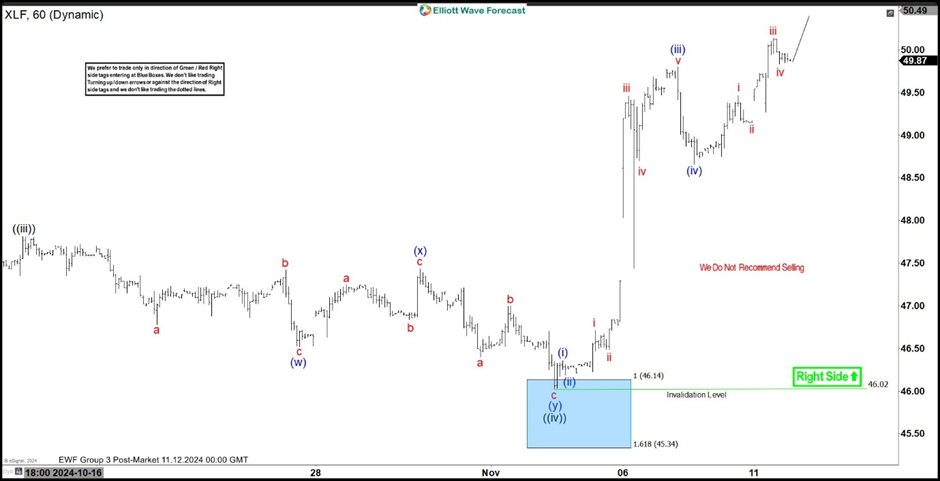
This is the latest 1-hour Elliott wave Chart from the 11.12.2024 Post-Market update. In which the ETF is showing a reaction higher taking place, right after ending the double correction within the blue box area. Allowed members to create a risk-free position shortly after taking the long position at the blue box area. Since then the ETF has managed to make a new high above $47.81 high. Confirming the next extension higher towards $50.48- $51.53 area before profit taking & a pullback happens in another 3 swings at least.

Author

Elliott Wave Forecast Team

Elliott Wave Forecast Team

ElliottWave-Forecast.com

More from Elliott Wave Forecast Team
Share:

Editor's Picks

EUR/USD meets initial support around 1.1800

EUR/USD remains on the back foot, although it has managed to reverse the initial strong pullback toward the 1.1800 region and regain some balance, hovering around the 1.1850 zone as the NA session draws to a close on Tuesday. Moving forward, market participants will now shift their attention to the release of the FOMC Minutes and US hard data on Wednesday.
 

GBP/USD bounces off lows, retargets 1.3550

After bottoming out just below the 1.3500 yardstick, GBP/USD now gathers some fresh bids and advances to the 1.3530-1.3540 band in the latter part of Tuesday’s session. Cable’s recovery comes as the Greenback surrenders part of its advance, although it keeps the bullish bias well in place for the day.

Gold remains offered below $5,000

Gold stays on the defensive on Tuesday, receding to the sub-$5,000 region per troy ounce on the back of the persistent move higher in the Greenback. The precious metal’s decline is also underpinned by the modest uptick in US Treasury yields across the spectrum.

RBNZ set to pause interest-rate easing cycle as new Governor Breman faces firm inflation

The Reserve Bank of New Zealand remains on track to maintain the Official Cash Rate at 2.25% after concluding its first monetary policy meeting of this year on Wednesday.

UK jobs market weakens, bolstering rate cut hopes

In the UK, the latest jobs report made for difficult reading. Nonetheless, this represents yet another reminder for the Bank of England that they need to act swiftly given the collapse in inflation expected over the coming months. 

Ripple slides to $1.45 as downside risks surge

Ripple edges lower at the time of writing on Tuesday, from the daily open of $1.48, as headwinds persist across the crypto market. A short-term support is emerging at $1.45, but a buildup of bearish positions could further weaken the derivatives market and prolong the correction.