|

XLF incomplete sequences calling the drop toward blue box area

In this technical article we’re going to take a look at the Elliott Wave charts charts of XLF ETF published in members area of the website.  As our members know XLF is giving us pull back against the May 3rd low.  Correction made clear 3 waves from the peak and reached the Equal Legs zone. In further text we’re going to explain the  Elliott Wave forecast.

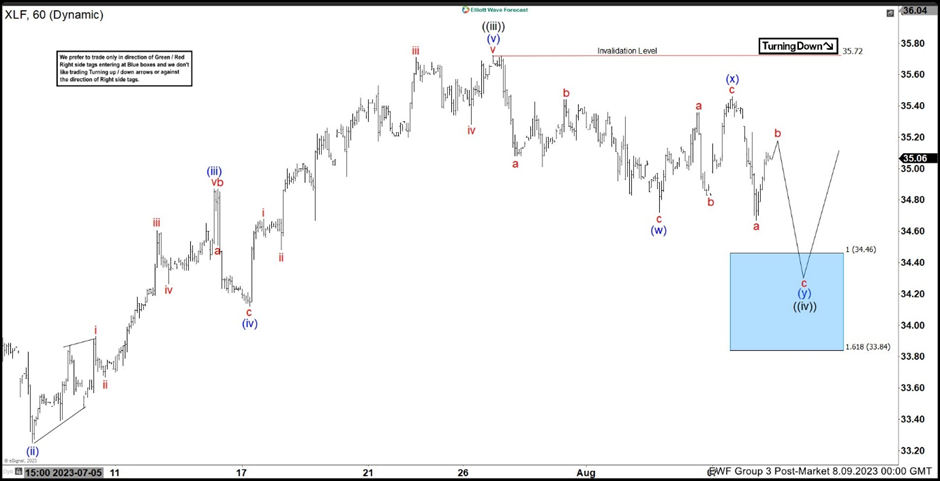
XLF Elliott Wave 1 hour chart 08.09.2023

Current view suggests the price is doing wave ((iv)) pull back. The ETF is showing incomplete sequences in the cycle from the 35.72 peak. At the moment we can count 5 swings down from the peak, which is incomplete structure. As far as the price stays below (x) blue high : 35.47 , we expect to see further extension down in 7th swing, targeting 34.46-33.84 area.

Chart

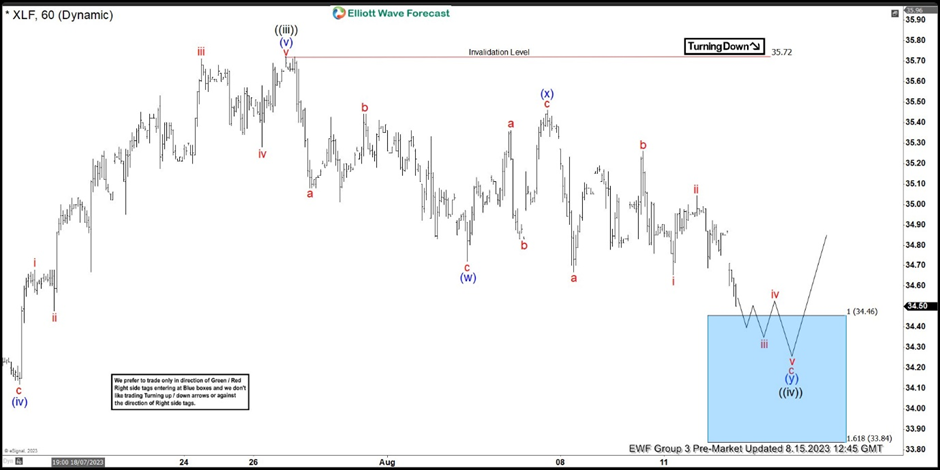
XLF Elliott Wave 1 Hour chart 08.09.2023

The price held below 35.47 high and we got the decline as expected. Short term b red recovery ended at 35.25 as 3 waves. At the moment the price is approaching first target at 34.46. Current wave count suggests we are in c red of (y) blue which can keep trading lower toward extreme zone 34.46-33.84. From that zone we can see turn higher again in 3 waves bounce at least. The break below 33.84 would invalidate the count.

Chart

Author

Elliott Wave Forecast Team

Elliott Wave Forecast Team

ElliottWave-Forecast.com

More from Elliott Wave Forecast Team
Share:

Editor's Picks

EUR/USD trims gains, hovers around 1.1900 post-US data

EUR/USD trades slightly on the back foot around the 1.1900 region in a context dominated by the resurgence of some buying interest around the US Dollar on turnaround Tuesday. Looking at the US docket, Retail Sales disappointed expectations in December, while the ADP 4-Week Average came in at 6.5K.

GBP/USD comes under pressure near 1.3680

The better tone in the Greenback hurts the risk-linked complex on Tuesday, prompting GBP/USD to set aside two consecutive days of gains and trade slightly on the defensive below the 1.3700 mark. Investors, in the meantime, keep their attention on key UK data due later in the week.

Gold loses some traction, still above $5,000

Gold faces some selling pressure on Tuesday, surrendering part of its recent two-day advance although managing to keep the trade above the $5,000 mark per troy ounce. The daily pullback in the precious metal comes in response to the modest rebound in the US Dollar, while declining US Treasury yields across the curve seem to limit the downside.

XRP holds $1.40 amid ETF inflows and stable derivatives market

Ripple trades under pressure, with immediate support at $1.40 holding at the time of writing on Tuesday. A recovery attempt from last week’s sell-off to $1.12 stalled at $1.54 on Friday, leading to limited price action between the current support and the resistance.

Dollar drops and stocks rally: The week of reckoning for US economic data

Following a sizeable move lower in US technology Stocks last week, we have witnessed a meaningful recovery unfold. The USD Index is in a concerning position; the monthly price continues to hold the south channel support.

XRP holds $1.40 amid ETF inflows and stable derivatives market

Ripple trades under pressure, with immediate support at $1.40 holding at the time of writing on Tuesday. A recovery attempt from last week’s sell-off to $1.12 stalled at $1.54 on Friday, leading to limited price action between the current support and the resistance.