Xero Limited Elliott Wave technical forecast [Video]
![Xero Limited Elliott Wave technical forecast [Video]](https://editorial.fxstreet.com/images/TechnicalAnalysis/ChartPatterns/Candlesticks/close-up-of-candlestick-stock-chart-with-pen-40815814_XtraLarge.jpg)
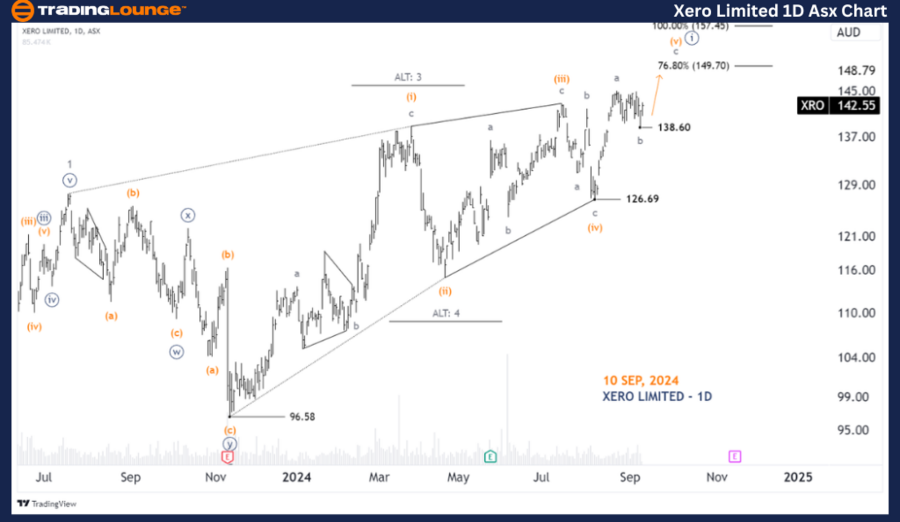
ASX: XERO LIMITED - XRO Elliott Elliott Wave Technical Analysis TradingLounge (1D Chart)
Greetings, Our Elliott Wave analysis today updates the Australian Stock Exchange (ASX) with XERO LIMITED - XRO. We see XERO LIMITED developing under a Diagonal, and in the short term, it could continue to push higher.
ASX: XRO one-day chart (semilog scale) analysis
Function: Major trend (Minute degree, navy).
Mode: Motive.
Structure: Impulse.
Position: Wave (v)-orange of Wave (i)-navy.
Details: Perhaps the whole pattern is developing as a Diagonal, and since the low of 126.69, the (v)-orange wave is continuing to push higher as a Zigzag. The maximum target it can reach is lower than the high at 157.45.
Invalidation point: 138.60.
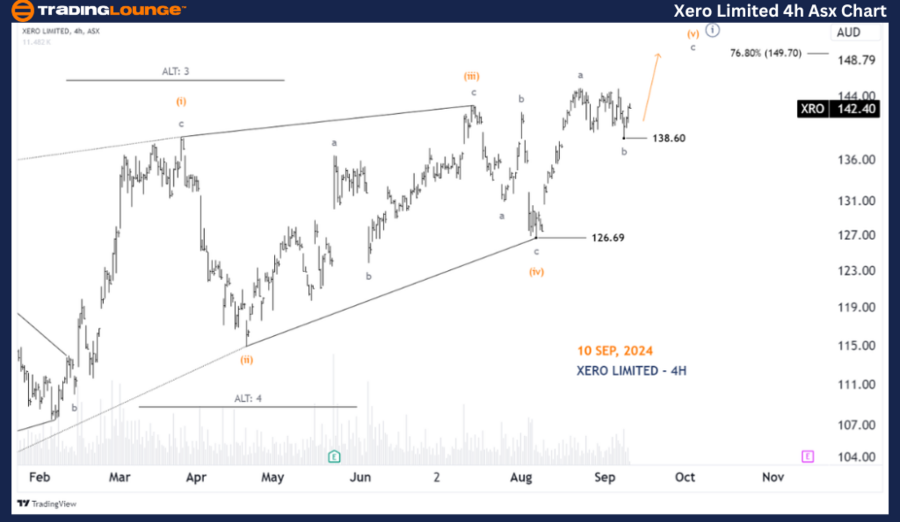
ASX: XRO four-hour chart analysis
Function: Major trend (Minute degree, navy).
Mode: Motive.
Structure: Impulse.
Position: Wave c-grey of Wave (iv)-orange.
Details: Since the low at 126.68, the (v)-orange wave is pushing higher as a Zigzag within the larger-degree Diagonal pattern. It itself looks like it just completed the b-grey wave at the low at 138.60, and the c-grey wave is unfolding to push higher, targeting the immediate target at the high at 149.70.
Invalidation point: 138.60.
Conclusion
Our analysis, forecast of contextual trends, and short-term outlook for ASX: XERO LIMITED - XRO aim to provide readers with insights into the current market trends and how to capitalize on them effectively. We offer specific price points that act as validation or invalidation signals for our wave count, enhancing the confidence in our perspective. By combining these factors, we strive to offer readers the most objective and professional perspective on market trends.
Xero Limited Elliott Wave technical forecast [Video]
Author

Peter Mathers
TradingLounge
Peter Mathers started actively trading in 1982. He began his career at Hoei and Shoin, a Japanese futures trading company.


