XAG/USD Price Analysis: Extends losses toward support at $21.50 psychological level


  • Silver price persists as market caution prevails regarding the Fed's interest rate trajectory.
  • Momentum indicators signal a potential bearish sentiment in the price movements.
  • The psychological level at $21.50 emerges as the immediate support.

Silver price continues to follow its downward trajectory, trading lower around $21.80 during the Asian session on Monday. The prices of non-yielding assets like Silver face challenges, primarily due to the upbeat US Treasury Yields. The yield on the 10-year US Treasury bond stands at 4.61%, up by 0.96% by the press time.

Furthermore, China released its Manufacturing PMI data over the weekend, indicating improvement and entering positive territory. However, this positive development did not seem to have a favorable impact on Silver prices.

Chinese NBS Manufacturing PMI for August increased to 50.2 from the previous 49.7 figures, surpassing the anticipated 50.0. Additionally, the Non-Manufacturing PMI climbed to 51.7 from the previous reading of 51.0, exceeding the market consensus of 51.5.

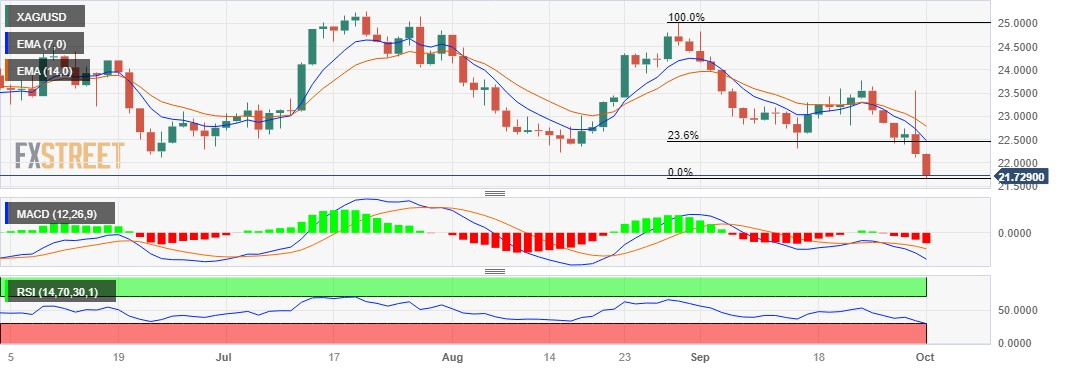
The current downward momentum in the pair appears to have a bearish bias, given that the 14-day Relative Strength Index (RSI) remains below the 50 level.

The XAG/USD pair could meet support at the $21.50 psychological level, following the $21.00 level.

On the upside, the 23.6% Fibonacci retracement at $22.46 lined up with the seven-day Exponential Moving Average (EMA) at $22.49.

A firm break above the latter could influence the XAG/USD pair to explore the area around the 14-day EMA at $22.79, followed by the $23.00 psychological level.

The Moving Average Convergence Divergence (MACD) indicator is providing a weak signal for the Silver bulls. The MACD line lies below the centerline and the signal line. This configuration suggests that there is potentially weak momentum in the XAG/USD's price movement.

XAG/USD: Daily Chart

XAG/USD: additional important levels

Overview
Today last price 21.86
Today Daily Change -0.33
Today Daily Change % -1.49
Today daily open 22.19
 
Trends
Daily SMA20 23.07
Daily SMA50 23.44
Daily SMA100 23.51
Daily SMA200 23.45
 
Levels
Previous Daily High 23.56
Previous Daily Low 22.12
Previous Weekly High 23.65
Previous Weekly Low 22.12
Previous Monthly High 24.82
Previous Monthly Low 22.12
Daily Fibonacci 38.2% 22.67
Daily Fibonacci 61.8% 23.01
Daily Pivot Point S1 21.69
Daily Pivot Point S2 21.18
Daily Pivot Point S3 20.24
Daily Pivot Point R1 23.13
Daily Pivot Point R2 24.07
Daily Pivot Point R3 24.58


Share: Feed news

Information on these pages contains forward-looking statements that involve risks and uncertainties. Markets and instruments profiled on this page are for informational purposes only and should not in any way come across as a recommendation to buy or sell in these assets. You should do your own thorough research before making any investment decisions. FXStreet does not in any way guarantee that this information is free from mistakes, errors, or material misstatements. It also does not guarantee that this information is of a timely nature. Investing in Open Markets involves a great deal of risk, including the loss of all or a portion of your investment, as well as emotional distress. All risks, losses and costs associated with investing, including total loss of principal, are your responsibility. The views and opinions expressed in this article are those of the authors and do not necessarily reflect the official policy or position of FXStreet nor its advertisers. The author will not be held responsible for information that is found at the end of links posted on this page.

If not otherwise explicitly mentioned in the body of the article, at the time of writing, the author has no position in any stock mentioned in this article and no business relationship with any company mentioned. The author has not received compensation for writing this article, other than from FXStreet.

FXStreet and the author do not provide personalized recommendations. The author makes no representations as to the accuracy, completeness, or suitability of this information. FXStreet and the author will not be liable for any errors, omissions or any losses, injuries or damages arising from this information and its display or use. Errors and omissions excepted.

The author and FXStreet are not registered investment advisors and nothing in this article is intended to be investment advice.

Recommended content


Recommended content

Editors’ Picks

EUR/USD retreats below 1.0900 after US inflation data

EUR/USD retreats below 1.0900 after US inflation data

EUR/USD stays under modest bearish pressure and trades below 1.0900 in the American session on Wednesday. Despite the softer-than-forecast February inflation data from the US, the US Dollar clings to daily recovery gains and makes it difficult for the pair to regain its traction.

EUR/USD News
Gold maintains its narrow range above $2,900 following US inflation

Gold maintains its narrow range above $2,900 following US inflation

Prices of Gold remain slightly bid following February’s US inflation readings, hovering around the $2,920 zone against the backdrop of a mild bid bias in the US Dollar and lower yields across the board. Markets remain focused on trade war headlines.

Gold News
GBP/USD pulls away from multi-month highs, holds above 1.2900

GBP/USD pulls away from multi-month highs, holds above 1.2900

After rising toward 1.3000 earlier in the day, GBP/USD struggles to hold its ground and trades below 1.2950 on Wednesday. The improving risk mood following the February US CPI data, however, helps the pair limit its losses. 

GBP/USD News
Bitcoin, XRP and Solana slump with US stock sell-off, Lummis eyes 1 million BTC purchase

Bitcoin, XRP and Solana slump with US stock sell-off, Lummis eyes 1 million BTC purchase

Bitcoin (BTC), XRP and Solana (SOL) prices struggle on Wednesday. The three tokens rank in the top 5 cryptocurrencies by market capitalization, and the risk-off sentiment in the crypto market has ushered in a cooling-off period. 

Read more
Gold maintains its narrow range above $2,900 following US inflation

Gold maintains its narrow range above $2,900 following US inflation

Prices of Gold remain slightly bid following February’s US inflation readings, hovering around the $2,920 zone against the backdrop of a mild bid bias in the US Dollar and lower yields across the board. Markets remain focused on trade war headlines.

Gold News
The Best brokers to trade EUR/USD

The Best brokers to trade EUR/USD

SPONSORED Discover the top brokers for trading EUR/USD in 2025. Our list features brokers with competitive spreads, fast execution, and powerful platforms. Whether you're a beginner or an expert, find the right partner to navigate the dynamic Forex market.

Read More

Forex MAJORS

Cryptocurrencies

Signatures

Best Brokers of 2025