- Middle East conflict concerns continue to drive up fossil fuels.
- US inflation concerns briefly knocked back barrel costs before a late-day rebound.
- WTI continues a painful grind in a tug-of-war between supply constraint fears and actual supply.
West Texas Intermediate (WTI) US Crude Oil jumped on Thursday after Iran announced the capture of a civilian oil tanker in the Gulf of Oman early in the day. Official Iranian state media has declared the seizure a retaliation for the US’ seizure of the exact same ship a year ago when it was bound for Iran.
With Middle East tensions, mostly surrounding Iran, continue to plague global supply line concerns, Crude Oil is set to continue seeing a bumpy ride through 2024.
US Crude Oil and oil derivative stocks continue to outrun market forecasts, with massive buildups in gasoline and oil products continuing to burgeon. Despite logistics concerns, Crude Oil supplies continue to thumb a nose at market participants, especially as the US continues to ramp up its domestic Crude Oil production as a net exporter.
Global demand for oil is also on the decline, focused on declining growth from China, and the Organization for the Petroleum Exporting Countries (OPEC) and its loose collection of allied non-member states, OPEC+, continues to grapple with severe production cuts having a limited effect. OPEC members are increasingly unwilling to go along with continuing production cap decreases being strong-armed through OPEC’s leadership, lead by Saudi Arabia. Smaller OPEC members overwhelmingly rely on producing and exporting Crude Oil to balance their government budgets.
WTI Technical Outlook
US Crude Oil is broadly up on Thursday in rough trading, starting the day’s trading below $71.50 per barrel and testing into the $73.00 handle after crossing the key level multiple time throughout the day.
WTI peaked near $74.00 per barrel in early Thursday run-up before descending back into the $72.00.
WTI rebounded once more, testing back into the $73.00 handle as US Crude Oil resumes trading inside of a rough range that has plagued WTI since the start of 2024.
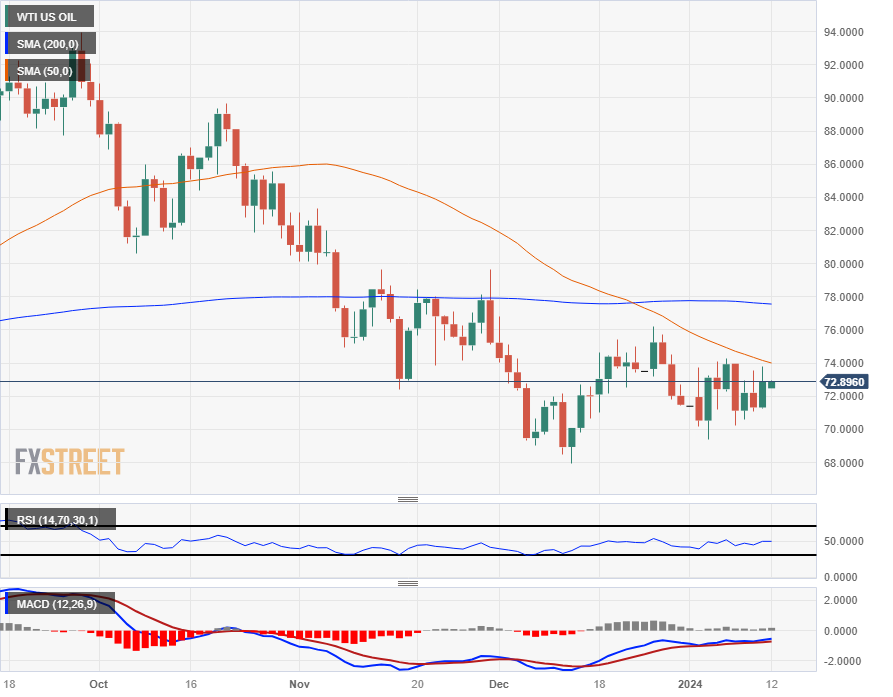
Daily candlesticks continue to trade on the south side of the 200-day Simple Moving Average (SMA) at the $78.00 handle, with near-term action further constrained by the 50-day SMA descending into $74.00.
WTI Hourly Chart

WTI Daily Chart
WTI Technical Levels
Information on these pages contains forward-looking statements that involve risks and uncertainties. Markets and instruments profiled on this page are for informational purposes only and should not in any way come across as a recommendation to buy or sell in these assets. You should do your own thorough research before making any investment decisions. FXStreet does not in any way guarantee that this information is free from mistakes, errors, or material misstatements. It also does not guarantee that this information is of a timely nature. Investing in Open Markets involves a great deal of risk, including the loss of all or a portion of your investment, as well as emotional distress. All risks, losses and costs associated with investing, including total loss of principal, are your responsibility. The views and opinions expressed in this article are those of the authors and do not necessarily reflect the official policy or position of FXStreet nor its advertisers. The author will not be held responsible for information that is found at the end of links posted on this page.
If not otherwise explicitly mentioned in the body of the article, at the time of writing, the author has no position in any stock mentioned in this article and no business relationship with any company mentioned. The author has not received compensation for writing this article, other than from FXStreet.
FXStreet and the author do not provide personalized recommendations. The author makes no representations as to the accuracy, completeness, or suitability of this information. FXStreet and the author will not be liable for any errors, omissions or any losses, injuries or damages arising from this information and its display or use. Errors and omissions excepted.
The author and FXStreet are not registered investment advisors and nothing in this article is intended to be investment advice.
Recommended content
Editors’ Picks

EUR/USD holds above 1.0400 in quiet trading
EUR/USD trades in positive territory above 1.0400 in the American session on Friday. The absence of fundamental drivers and thin trading conditions on the holiday-shortened week make it difficult for the pair to gather directional momentum.

GBP/USD recovers above 1.2550 following earlier decline
GBP/USD regains its traction and trades above 1.2550 after declining toward 1.2500 earlier in the day. Nevertheless, the cautious market mood limits the pair's upside as trading volumes remain low following the Christmas break.

Gold declines below $2,620, erases weekly gains
Gold edges lower in the second half of the day and trades below $2,620, looking to end the week marginally lower. Although the cautious market mood helps XAU/USD hold its ground, growing expectations for a less-dovish Fed policy outlook caps the pair's upside.

Bitcoin misses Santa rally even as on-chain metrics show signs of price recovery
Bitcoin (BTC) price hovers around $97,000 on Friday, erasing most of the gains from earlier this week, as the largest cryptocurrency missed the so-called Santa Claus rally, the increase in prices prior to and immediately following Christmas Day.

2025 outlook: What is next for developed economies and currencies?
As the door closes in 2024, and while the year feels like it has passed in the blink of an eye, a lot has happened. If I had to summarise it all in four words, it would be: ‘a year of surprises’.

Best Forex Brokers with Low Spreads
VERIFIED Low spreads are crucial for reducing trading costs. Explore top Forex brokers offering competitive spreads and high leverage. Compare options for EUR/USD, GBP/USD, USD/JPY, and Gold.