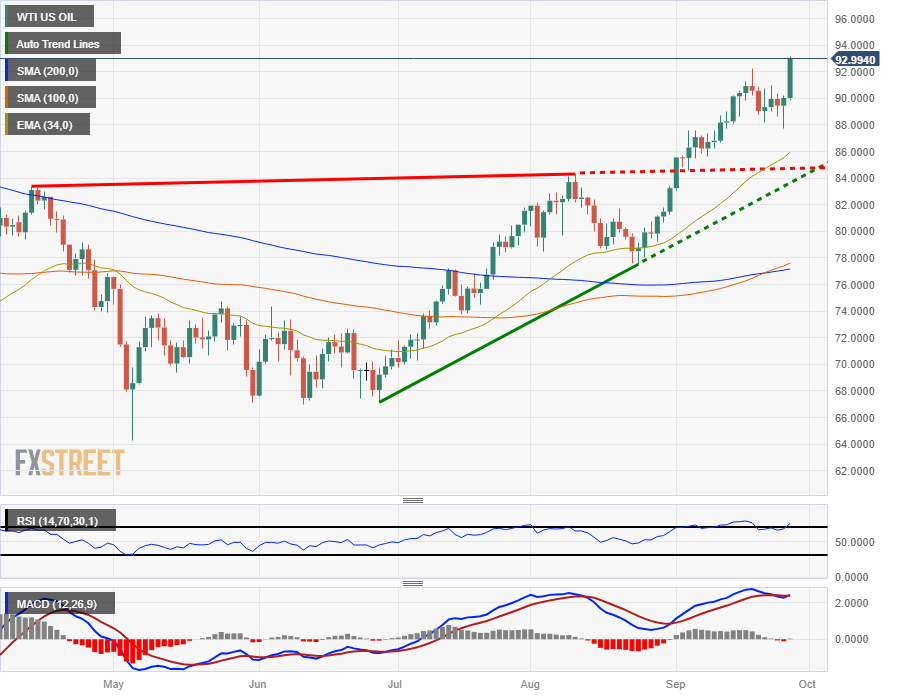
- WTI is testing the $93/bbl level in Wednesday trading.
- US crude oil is getting shocked higher after a surprise drawdown in reserves.
- Supply constraints are choking oil prices, sending barrel prices surging.
West Texas Intermediary (WTI) US crude oil prices are leaping higher for the day, pushed by an unexpected drawdown in US crude reserves. WTI reached a 13-month high of $93.18 and is poised for further upside as prices bake in around $93.00.
Energy Information Administration (EIA) crude oil inventories showed a surprise drop in US crude oil reserves, with the national supply declining over 2 million barrels versus the forecast -320K.
Reserves at the Cushing, Oklahoma oil reservoir showed declines of just below a million barrels, adding to the over 2 million barrel decline last week.
The EIA estimates that US crude oil reserves now sit just beneath 420 million barrels.
With oil demand continuing to climb, global energy production is expected to remain below supply equilibrium for the foreseeable future until production is increased. The current daily crude supply undershoot is estimated to be around 2 million barrels.
Saudi Arabia and Russia recently announced an extension of their combined 1.3 million bpd production cuts through the end of the year, and Russia is adding to price pressures after further restricting oil exports outside of Russia.
WTI technical outlook
With WTI pinning into fresh 13-month highs, technical resistance is thinning out on both the intraday and long-term outlooks. Oil bidders will immediately be looking for a push to $94/bbl, but with US crude prices riding so high for so long an extended relief rally could see technical indicators reset before a renewed push higher.
WTI is up almost 20% from the last swing low near $78.00, and a rising trendline from June's bottoms near $68.00 is providing additional technical support.
A breakdown to the 34-day Exponential Moving Average (EMA) currently at $86.00 could see a rebound, while a successful bearish break will have to contend with the 200-day Simple Moving Average (SMA) near $77.00.
WTI daily chart

WTI technical levels
Information on these pages contains forward-looking statements that involve risks and uncertainties. Markets and instruments profiled on this page are for informational purposes only and should not in any way come across as a recommendation to buy or sell in these assets. You should do your own thorough research before making any investment decisions. FXStreet does not in any way guarantee that this information is free from mistakes, errors, or material misstatements. It also does not guarantee that this information is of a timely nature. Investing in Open Markets involves a great deal of risk, including the loss of all or a portion of your investment, as well as emotional distress. All risks, losses and costs associated with investing, including total loss of principal, are your responsibility. The views and opinions expressed in this article are those of the authors and do not necessarily reflect the official policy or position of FXStreet nor its advertisers. The author will not be held responsible for information that is found at the end of links posted on this page.
If not otherwise explicitly mentioned in the body of the article, at the time of writing, the author has no position in any stock mentioned in this article and no business relationship with any company mentioned. The author has not received compensation for writing this article, other than from FXStreet.
FXStreet and the author do not provide personalized recommendations. The author makes no representations as to the accuracy, completeness, or suitability of this information. FXStreet and the author will not be liable for any errors, omissions or any losses, injuries or damages arising from this information and its display or use. Errors and omissions excepted.
The author and FXStreet are not registered investment advisors and nothing in this article is intended to be investment advice.
Recommended content
Editors’ Picks

AUD/USD drops to 0.6350 as markets turn cautious on trade uncertainty
AUD/USD is falling back toward 0.6350 in Thursday's Asian trading amid fading optimism over a quick resolution to the US-China trade dispute. Meanwhile, a renewed US Dollar selling on looming trade uncertainty, concerning US, China and Japan could limit the pair's downside.

USD/JPY tumbles toward 142.50 amid US-Japan trade talks
USD/JPY closes in on 142.50, correcting sharply from over a one-week top set on Wednesday. Uncertainty over the US-Japan trade talks and the divergent BoJ-Fed policy expectations continue to offer a double-whammy to the pair amid a fresh bout of US Dollar selling.

Gold price bounces back above $3,350 on fading US-China trade deal optimism
Gold price regains positive traction abpve $3,350 in the Asian session on Thursday, snapping a two-day losing streak to the $3,260 area, or the weekly low touched the previous day. The optimism over a possible US-China trade deal fades quickly and revives demand for the safe-haven bullion.

Ethereum ETF sees boost as bulls target descending channel resistance
Ethereum gained 2% on Wednesday after US spot Ether ETFs recorded their largest inflows since February 4. However, the top altcoin could face a correction after experiencing a rejection at its 50-day Simple Moving Average.

Five fundamentals for the week: Traders confront the trade war, important surveys, key Fed speech Premium
Will the US strike a trade deal with Japan? That would be positive progress. However, recent developments are not that positive, and there's only one certainty: headlines will dominate markets. Fresh US economic data is also of interest.

The Best brokers to trade EUR/USD
SPONSORED Discover the top brokers for trading EUR/USD in 2025. Our list features brokers with competitive spreads, fast execution, and powerful platforms. Whether you're a beginner or an expert, find the right partner to navigate the dynamic Forex market.


