WTI testing bullish commitments around $79, downside remains favored


  • WTI keeps falling as inflation woes dent appetite for riskier assets.
  • WTI is weighed down by the prospects of the US SPR release.
  • The US oil is still eyeing symmetrical triangle breakdown on the 1D chart.

WTI (NYMEX futures) is pressurizing multi-day lows, flirting with the $79 mark, as persistent inflation concerns continue to sap investors’ confidence in higher-yielding assets such as oil.

The US oil also remains undermined by the increased calls for the US to release oil supplies from its Strategic Petroleum Reserves (SPR) to alieviate the pressure off the tightening oil market.

At the time of writing, WTI is posting small losses to trade at $79.30, little affected by the comments from the UAE and Oman Energy Ministers, as investors await the virtual meeting between the US and Chinese Presidents for a fresh take on the market sentiment.

From a short-term technical perspective, WTI continues to challenge the bullish commitments at the rising trendline support on the daily chart at $79.27.

The price briefly dipped below the latter on Friday but managed to recapture in on a weekly closing basis.

If WTI closes below the latter on Monday, then it will confirm a downside breakout from a two-month-long symmetrical triangle formation.

A fresh downswing will kick in, thereafter, opening floors towards ascending 200-Daily Moving Average (DMA) at $68.82.

Before reaching the 200-DMA, WTI bulls will look to find some support at the 50-DMA at $77.50.

The next support at the mildly bullish 100-DMA at $73.62 will appear on a firm break below the 50-DMA.

The 14-day Relative Strength Index (RSI) points south below the 50.00 level, allowing room for more declines.  

 WTI: Daily chart

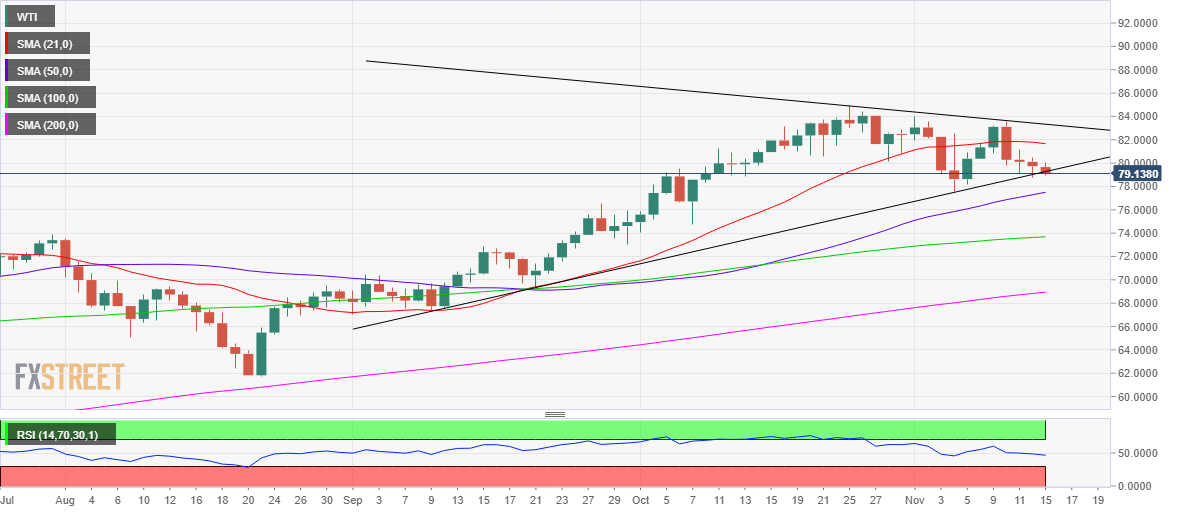
On the flip side, any recovery attempts could meet the initial supply at the $80 round figure, above which the horizontal 21-DMA at $81.65 would be tested.

The falling trendline resistance at $83.39 will act as a tough nut to crack for WTI bulls if the recovery momentum picks up pace.

Acceptance above the latter could yield a triangle breakout, which could reinforce the bullish interests.

WTI: Additional levels to watch

WTI

Overview
Today last price 79.27
Today Daily Change -0.47
Today Daily Change % -0.59
Today daily open 79.74
 
Trends
Daily SMA20 81.78
Daily SMA50 77.29
Daily SMA100 73.63
Daily SMA200 68.83
 
Levels
Previous Daily High 80.48
Previous Daily Low 78.77
Previous Weekly High 83.59
Previous Weekly Low 78.77
Previous Monthly High 84.98
Previous Monthly Low 74.06
Daily Fibonacci 38.2% 79.42
Daily Fibonacci 61.8% 79.83
Daily Pivot Point S1 78.85
Daily Pivot Point S2 77.96
Daily Pivot Point S3 77.14
Daily Pivot Point R1 80.55
Daily Pivot Point R2 81.37
Daily Pivot Point R3 82.26


Share: Feed news

Information on these pages contains forward-looking statements that involve risks and uncertainties. Markets and instruments profiled on this page are for informational purposes only and should not in any way come across as a recommendation to buy or sell in these assets. You should do your own thorough research before making any investment decisions. FXStreet does not in any way guarantee that this information is free from mistakes, errors, or material misstatements. It also does not guarantee that this information is of a timely nature. Investing in Open Markets involves a great deal of risk, including the loss of all or a portion of your investment, as well as emotional distress. All risks, losses and costs associated with investing, including total loss of principal, are your responsibility. The views and opinions expressed in this article are those of the authors and do not necessarily reflect the official policy or position of FXStreet nor its advertisers. The author will not be held responsible for information that is found at the end of links posted on this page.

If not otherwise explicitly mentioned in the body of the article, at the time of writing, the author has no position in any stock mentioned in this article and no business relationship with any company mentioned. The author has not received compensation for writing this article, other than from FXStreet.

FXStreet and the author do not provide personalized recommendations. The author makes no representations as to the accuracy, completeness, or suitability of this information. FXStreet and the author will not be liable for any errors, omissions or any losses, injuries or damages arising from this information and its display or use. Errors and omissions excepted.

The author and FXStreet are not registered investment advisors and nothing in this article is intended to be investment advice.

XM
Account
7.2
Tools
9.2
Service
9.4
Trading
9.0
Trust
7.0
Experience
8.4
Read review
Moneta Markets
Account
7.4
Tools
6.6
Service
8.0
Trading
6.6
Trust
5.2
Experience
9.2
Read review
Trading Pro
Account
7.2
Tools
5.2
Service
6.6
Trading
8.0
Trust
5.0
Experience
7.0
Read review
Pepperstone
Account
8.2
Tools
8.2
Service
7.4
Trading
9.0
Trust
8.8
Experience
9.0
Read review
XM
Read review
Moneta Markets
Read review
Trading Pro
Read review
Pepperstone
Read review
Trading Pro
Read review
Pepperstone
Read review
XM
Read review
Moneta Markets
Read review
Trading Pro
Account
7.2
Tools
5.2
Service
6.6
Trading
8.0
Trust
5.0
Experience
7.0
Read review
Pepperstone
Account
8.2
Tools
8.2
Service
7.4
Trading
9.0
Trust
8.8
Experience
9.0
Read review
XM
Account
7.2
Tools
9.2
Service
9.4
Trading
9.0
Trust
7.0
Experience
8.4
Read review
Moneta Markets
Account
7.4
Tools
6.6
Service
8.0
Trading
6.6
Trust
5.2
Experience
9.2
Read review

Recommended content


Recommended content

Editors’ Picks

Gold hovers around all-time highs near $3,250

Gold hovers around all-time highs near $3,250


Gold is holding steady near the $3,250 mark, fuelled by robust safe-haven demand, trade war concerns, and a softer-than-expected US inflation gauge. The US Dollar keeps trading with heavy losses around three-year lows.

Gold News
EUR/USD retreats towards 1.1300 as Wall Street shrugs off trade war headlines

EUR/USD retreats towards 1.1300 as Wall Street shrugs off trade war headlines

The EUR/USD pair retreated further from its recent multi-month peak at 1.1473 and trades around the 1.1300 mark. Wall Street manages to advance ahead of the weekly close, despite escalating tensions between Washington and Beijing and mounting fears of a US recession. Profit-taking ahead of the close also weighs on the pair. 

EUR/USD News
GBP/USD trims gains, recedes to the 1.3050 zone

GBP/USD trims gains, recedes to the 1.3050 zone

GBP/USD now gives away part of the earlier advance to fresh highs near 1.3150. Meanwhile, the US Dollar remains offered amid escalating China-US trade tensions, recession fears in the US, and softer-than-expected US Producer Price data.

GBP/USD News
Bitcoin, Ethereum, Dogecoin and Cardano stabilze –  Why crypto is in limbo

Bitcoin, Ethereum, Dogecoin and Cardano stabilze –  Why crypto is in limbo

Bitcoin, Ethereum, Dogecoin and Cardano stabilize on Friday as crypto market capitalization steadies around $2.69 trillion. Crypto traders are recovering from the swing in token prices and the Monday bloodbath. 

Read more
Is a recession looming?

Is a recession looming?

Wall Street skyrockets after Trump announces tariff delay. But gains remain limited as Trade War with China continues. Recession odds have eased, but investors remain fearful. The worst may not be over, deeper market wounds still possible.

Read more
The Best brokers to trade EUR/USD

The Best brokers to trade EUR/USD

SPONSORED Discover the top brokers for trading EUR/USD in 2025. Our list features brokers with competitive spreads, fast execution, and powerful platforms. Whether you're a beginner or an expert, find the right partner to navigate the dynamic Forex market.

Read More

Forex MAJORS

Cryptocurrencies

Signatures

Best Brokers of 2025