- Western Texas Intermediate recovers some ground even though the US Dollar remains buoyant.
- IEA’s Director commented that China’s reopening would drive oil prices.
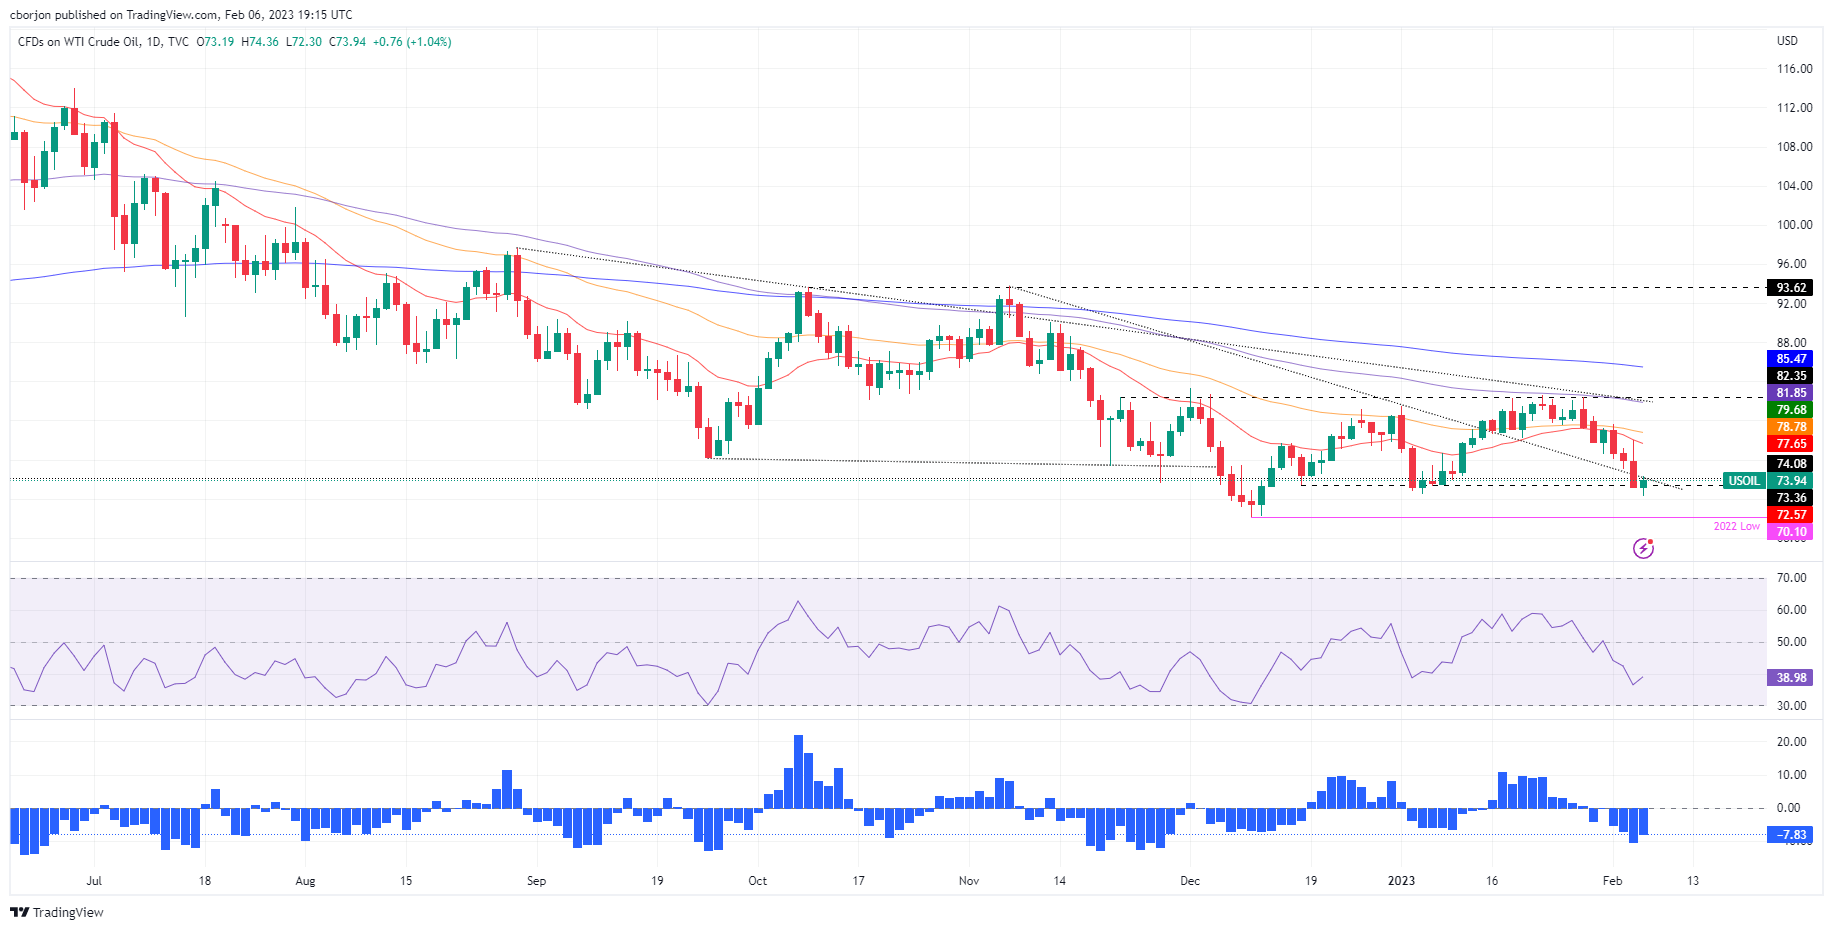
- WTI Technical Analysis: Triple bottom looms around $72.50.
US crude oil benchmark known as Western Texas Intermediate (WTI) records minimal gains after diving toward an eight-week low at $72.30 per barrel on Monday, exchanging hands at around $73.96 per barrel, capped by a strong US Dollar (USD) across the board.
Wall Street’s extended its losses on Monday due to market participants repricing a less dovish Federal Reserve (Fed) as expected. Money market futures estimates 50 bps of rate hikes by the US central banks, which would lift the Fed Funds target to the 5%-5.25% range. Hence, the greenback continues to extend its recovery, as shown by the US Dollar Index, a measure of the buck’s value against a basket of six currencies, up 0.69%, at 103.703.
Since last Friday, WTI has slid 3%, following the robust US employment data.
Even though a strong US Dollar is a headwind for the “black gold,” China’s reopening prospects remain a driver for oil prices, as the International Energy Agency (IEA) Executive Director Fatih Birol reported. Birol commented that producers might reconsider their output policies as China’s Covid-19 relaxation would increase demand for crude. He added, “We expect about half of the growth in global oil demand this year will come from China.”
Oil traders should be aware that price caps on Russian products began on Sunday, as G7 nations, the EU and Australia, agreed on price limits of oil-refined Russian products.
WTI Technical Analysis
Technically, WTI is still downward biased as long as the quote stands below $82.00 PB. Additionally, last Friday’s WTI failure to crack the 20-day Exponential Moving Average (EMA) at $77.65 exacerbated oil’s fall toward the year’s lows, at $72.30, breaking below the January 4 low of $72.50.
Nevertheless, since then, oil has rebounded and is aiming toward the $73.80 area, opening the door for a leg up. Hence, WTI’s first resistance would be $74.00. A breach of the latter will expose the 20-day EMA at 77.64, followed by the $78.00 psychological level, ahead of the 50-day EMA at $78.77. Conversely, WTI’s would resume downwards once it breaks beneath $72.30.
Information on these pages contains forward-looking statements that involve risks and uncertainties. Markets and instruments profiled on this page are for informational purposes only and should not in any way come across as a recommendation to buy or sell in these assets. You should do your own thorough research before making any investment decisions. FXStreet does not in any way guarantee that this information is free from mistakes, errors, or material misstatements. It also does not guarantee that this information is of a timely nature. Investing in Open Markets involves a great deal of risk, including the loss of all or a portion of your investment, as well as emotional distress. All risks, losses and costs associated with investing, including total loss of principal, are your responsibility. The views and opinions expressed in this article are those of the authors and do not necessarily reflect the official policy or position of FXStreet nor its advertisers. The author will not be held responsible for information that is found at the end of links posted on this page.
If not otherwise explicitly mentioned in the body of the article, at the time of writing, the author has no position in any stock mentioned in this article and no business relationship with any company mentioned. The author has not received compensation for writing this article, other than from FXStreet.
FXStreet and the author do not provide personalized recommendations. The author makes no representations as to the accuracy, completeness, or suitability of this information. FXStreet and the author will not be liable for any errors, omissions or any losses, injuries or damages arising from this information and its display or use. Errors and omissions excepted.
The author and FXStreet are not registered investment advisors and nothing in this article is intended to be investment advice.
Recommended content
Editors’ Picks

EUR/USD extends recovery beyond 1.0400 amid Wall Street's turnaround
EUR/USD extends its recovery beyond 1.0400, helped by the better performance of Wall Street and softer-than-anticipated United States PCE inflation. Profit-taking ahead of the winter holidays also takes its toll.

GBP/USD nears 1.2600 on renewed USD weakness
GBP/USD extends its rebound from multi-month lows and approaches 1.2600. The US Dollar stays on the back foot after softer-than-expected PCE inflation data, helping the pair edge higher. Nevertheless, GBP/USD remains on track to end the week in negative territory.

Gold rises above $2,620 as US yields edge lower
Gold extends its daily rebound and trades above $2,620 on Friday. The benchmark 10-year US Treasury bond yield declines toward 4.5% following the PCE inflation data for November, helping XAU/USD stretch higher in the American session.

Bitcoin crashes to $96,000, altcoins bleed: Top trades for sidelined buyers
Bitcoin (BTC) slipped under the $100,000 milestone and touched the $96,000 level briefly on Friday, a sharp decline that has also hit hard prices of other altcoins and particularly meme coins.

Bank of England stays on hold, but a dovish front is building
Bank of England rates were maintained at 4.75% today, in line with expectations. However, the 6-3 vote split sent a moderately dovish signal to markets, prompting some dovish repricing and a weaker pound. We remain more dovish than market pricing for 2025.

Best Forex Brokers with Low Spreads
VERIFIED Low spreads are crucial for reducing trading costs. Explore top Forex brokers offering competitive spreads and high leverage. Compare options for EUR/USD, GBP/USD, USD/JPY, and Gold.
