• WTI’s trim some of their weekly losses, bolstered by a weak US Dollar.
  • Easing inflation in the United States undermined the US Dollar as traders brace for a less aggressive Fed.
  • China’s refineries asked Saidu Aramco to reduce December’s crude-oil volumes, capping WTI’s recovery.

Western Texas Intermediate (WTI), the US crude oil benchmark, is recovering some ground during the North American session following the United States (US) inflation report that informed prices are easing. Another factor that boosted the appetite for Oil is China’s easing Covid-19 restrictions, underpinned oil prices. At the time of writing, WTI is trading at $88.29 per barrel, gaining 2.37%.

Sentiment remains positive as a cooler-than-expected US Consumer Price Index (CPI) information showed that the US economy is feeling the impact of the Federal Reserve (Fed) monetary policy. The headline inflation came at 7.7% YoY, and the core CPI fell to 6.3% YoY, both below expectations. Following the release, speculations piled up that the Fed might gradually increase the Federal Funds rate (FFR) instead of raising rates on 75 bps ones. The reflection is that odds for a Fed 50 bps rate hike in December jumped from 50% to 85%.

Therefore, the US Dollar (USD) weakened across the board, as the US Dollar Index plunged 3.76% in the week, undermined by US Treasury yields, plummeting almost 30 bps.

Aside from this, Chinese officials announced that quarantines for inbound travelers would be cut by two days to five, a sign cheered by investors.

According to Reuters, several Chinese refiners asked Saudi Aramco to reduce December-loading crude oil volumes, meaning that China’s economy is accounting for a deceleration as it’s struggling to avoid a recession.

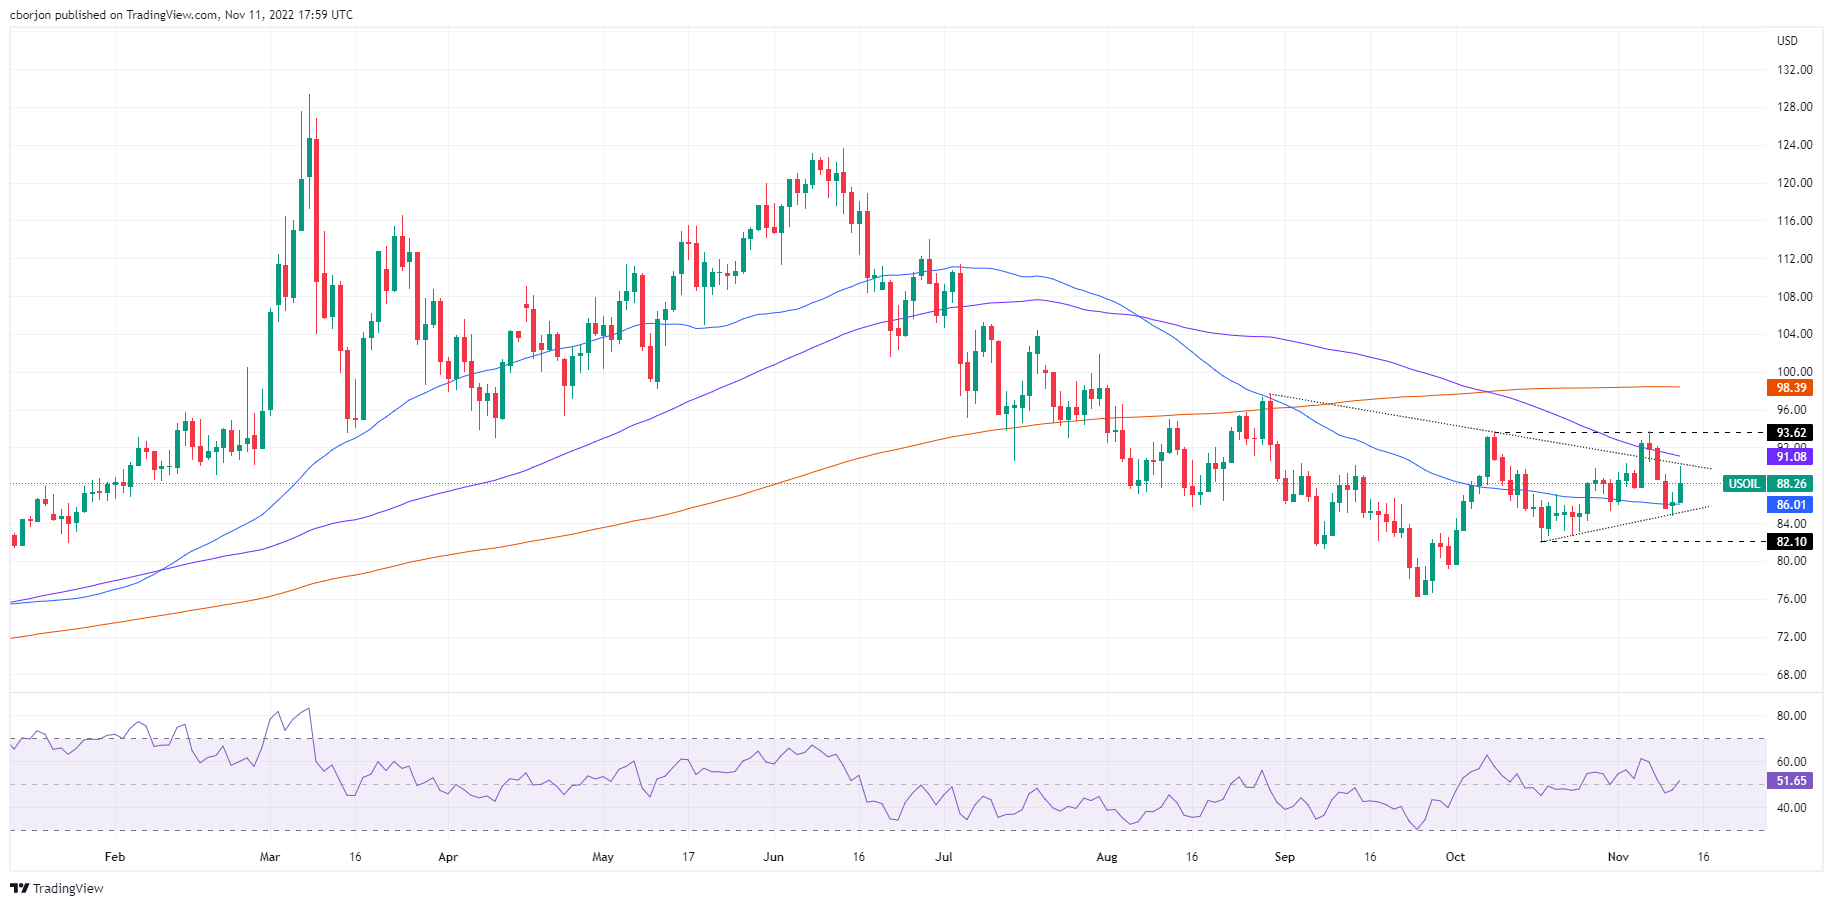
WTI Price Analysis: Technical outlook

WTI is neutral-biased, as shown by the daily chart. It should be noted that Friday’s daily high at $90.08 tested a one-month-old downslope trendline drawn from September highs. However, WTI was quickly rejected and retreated above November’s 10 daily high at $87.31. The Relative Strength Index (RSI) in bullish territory suggests Oil prices could increase. However, WTI needs to clear the $90.00 mark, alongside the 100-day Exponential Moving Average (EMA) at $91.07, to turn the bias neutral to upwards.

WTI US OIL

Overview
Today last price 87.58
Today Daily Change 1.93
Today Daily Change % 2.25
Today daily open 85.65
 
Trends
Daily SMA20 86.59
Daily SMA50 85.51
Daily SMA100 90.52
Daily SMA200 97.45
 
Levels
Previous Daily High 86.63
Previous Daily Low 84.06
Previous Weekly High 92.09
Previous Weekly Low 84.78
Previous Monthly High 92.63
Previous Monthly Low 79.32
Daily Fibonacci 38.2% 85.65
Daily Fibonacci 61.8% 85.04
Daily Pivot Point S1 84.26
Daily Pivot Point S2 82.87
Daily Pivot Point S3 81.69
Daily Pivot Point R1 86.83
Daily Pivot Point R2 88.02
Daily Pivot Point R3 89.41


Share: Feed news

Information on these pages contains forward-looking statements that involve risks and uncertainties. Markets and instruments profiled on this page are for informational purposes only and should not in any way come across as a recommendation to buy or sell in these assets. You should do your own thorough research before making any investment decisions. FXStreet does not in any way guarantee that this information is free from mistakes, errors, or material misstatements. It also does not guarantee that this information is of a timely nature. Investing in Open Markets involves a great deal of risk, including the loss of all or a portion of your investment, as well as emotional distress. All risks, losses and costs associated with investing, including total loss of principal, are your responsibility. The views and opinions expressed in this article are those of the authors and do not necessarily reflect the official policy or position of FXStreet nor its advertisers. The author will not be held responsible for information that is found at the end of links posted on this page.

If not otherwise explicitly mentioned in the body of the article, at the time of writing, the author has no position in any stock mentioned in this article and no business relationship with any company mentioned. The author has not received compensation for writing this article, other than from FXStreet.

FXStreet and the author do not provide personalized recommendations. The author makes no representations as to the accuracy, completeness, or suitability of this information. FXStreet and the author will not be liable for any errors, omissions or any losses, injuries or damages arising from this information and its display or use. Errors and omissions excepted.

The author and FXStreet are not registered investment advisors and nothing in this article is intended to be investment advice.

XM
Account
7.2
Tools
9.2
Service
9.4
Trading
9.0
Trust
7.0
Experience
8.4
Read review
Moneta Markets
Account
7.4
Tools
6.6
Service
8.0
Trading
6.6
Trust
5.2
Experience
9.2
Read review
Trading Pro
Account
7.2
Tools
5.2
Service
6.6
Trading
8.0
Trust
5.0
Experience
7.0
Read review
Pepperstone
Account
8.2
Tools
8.2
Service
7.4
Trading
9.0
Trust
8.8
Experience
9.0
Read review
XM
Read review
Moneta Markets
Read review
Trading Pro
Read review
Pepperstone
Read review
Trading Pro
Read review
Pepperstone
Read review
XM
Read review
Moneta Markets
Read review
Trading Pro
Account
7.2
Tools
5.2
Service
6.6
Trading
8.0
Trust
5.0
Experience
7.0
Read review
Pepperstone
Account
8.2
Tools
8.2
Service
7.4
Trading
9.0
Trust
8.8
Experience
9.0
Read review
XM
Account
7.2
Tools
9.2
Service
9.4
Trading
9.0
Trust
7.0
Experience
8.4
Read review
Moneta Markets
Account
7.4
Tools
6.6
Service
8.0
Trading
6.6
Trust
5.2
Experience
9.2
Read review

Recommended content


Recommended content

Editors’ Picks

EUR/USD reaches fresh 2025-high on broad US Dollar's weakness

EUR/USD reaches fresh 2025-high on broad US Dollar's weakness

EUR/USD retains its bullish momentum and reaches fresh 2025 highs in the American session on Thursday. The soft inflation data from the US and the growing fears over a deepening US-China trade conflict weigh heavily on the USD, fuelling the pair's rally.

EUR/USD News
GBP/USD retreats from daily highs, holds above 1.2900

GBP/USD retreats from daily highs, holds above 1.2900

GBP/USD retreats from the daily high it set near 1.2950 but manages to stay in positive territory above 1.2900. The US Dollar stays under strong selling pressure following the weaker-than-expected Consumer Price Index (CPI) data but the risk-averse market atmosphere limits the pair's upside.

GBP/USD News
Gold climbs to five-day highs around $3,150

Gold climbs to five-day highs around $3,150

Gold now accelerates its upside momentum and advances to multi-day peaks around the $3,150 mark per troy ounce, remaining within a touching distance of the record-high it set last week. The persistent selling pressure surrounding the US Dollar and the negative shift seen in risk mood help XAU/USD push higher.

Gold News
Cardano stabilizes near $0.62 after Trump’s 90-day tariff pause-led surge

Cardano stabilizes near $0.62 after Trump’s 90-day tariff pause-led surge

Cardano stabilizes around $0.62 on Thursday after a sharp recovery the previous day, triggered by US Donald Trump’s decision to pause tariffs for 90 days except for China and other countries that had retaliated against the reciprocal tariffs announced on April 2.

Read more
Trump’s tariff pause sparks rally – What comes next?

Trump’s tariff pause sparks rally – What comes next?

Markets staged a dramatic reversal Wednesday, led by a 12% surge in the Nasdaq and strong gains across major indices, following President Trump’s unexpected decision to pause tariff escalation for non-retaliating trade partners. 

Read more
The Best brokers to trade EUR/USD

The Best brokers to trade EUR/USD

SPONSORED Discover the top brokers for trading EUR/USD in 2025. Our list features brokers with competitive spreads, fast execution, and powerful platforms. Whether you're a beginner or an expert, find the right partner to navigate the dynamic Forex market.

Read More

Forex MAJORS

Cryptocurrencies

Signatures

Best Brokers of 2025