|

WTI Price Analysis: WTI trades below $75.00 on choppy session

  • WTI sets its second day in a row of losses as investors continue to take profits following a three-week gain streak.
  • Unexpected supply disruptions in Nigeria and Lybia may limit the downside’s potential.
  • Eyes on Tuesday’s Retail Sales data from the US.


At the start of the week, the West Texas Intermediate (WTI) barrel fell below $75.00. The downside movements may be explained by investors taking profits and a slight recovery of the US Dollar.

The focus is set on Tuesday’s Retail Sales data from the US from June. As the USD significantly weakened following soft inflation figures from June which fueled dovish bets on the Federal Reserve (Fed), weak Retail Sales figure could fire another downwards leg for the Greenback. As for now, markets are expecting the headline figure to have increased 0.5% MoM in June while the sales excluding the Automobile sectors to have expanded 0.3% MoM.

Meanwhile, according to the CME FedWatch Tool, investors have largely priced in a 25 basis points (bps) hike in the next July 26 meeting of the Fed but the odds of another hike in 2023 have dropped to nearly 20%. In that sense, as higher interest rates tend to be negatively correlated with Oil prices, the WTI could regain momentum if markets continue to bet on a dovish Fed.
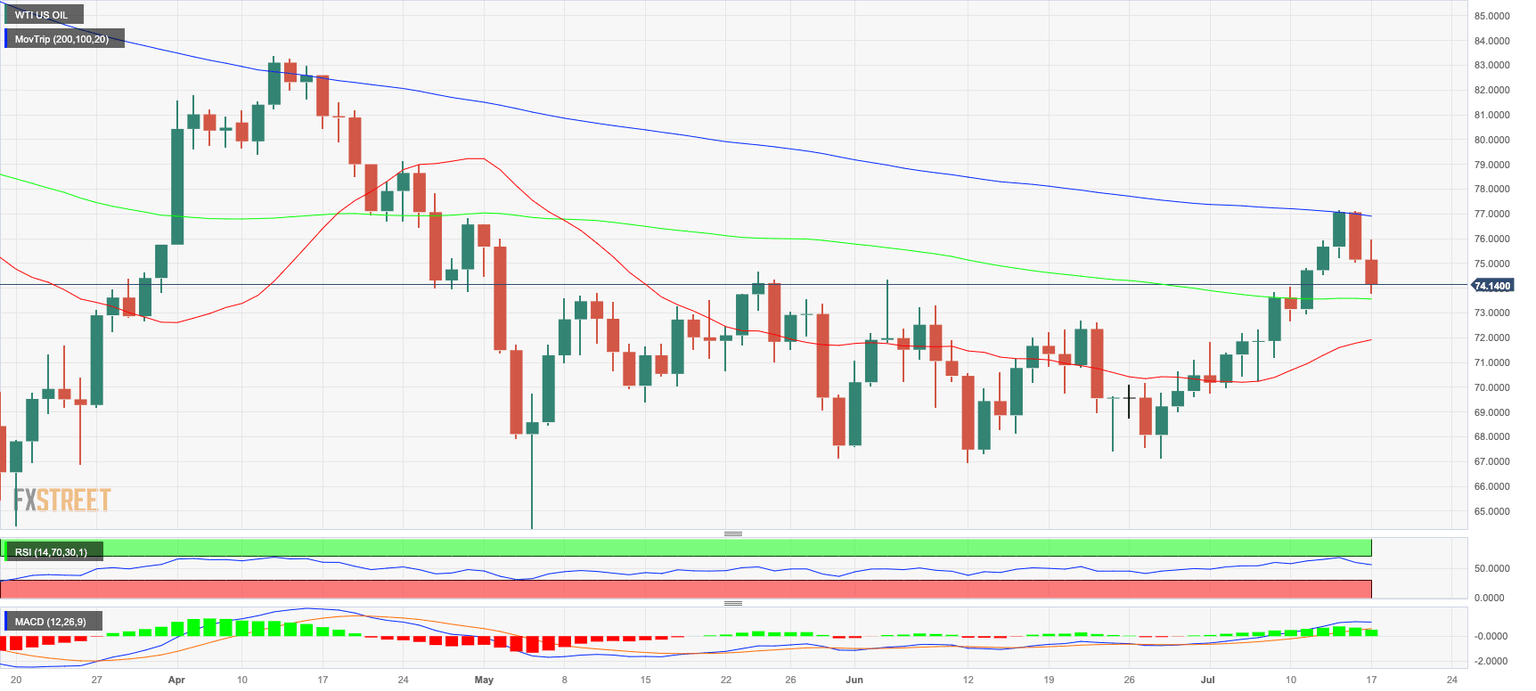
WTI Levels to watch

The daily chart suggest that the technical outlook is neutral to bearish for the short term. The Relative Strength Index (RSI) displays a negative slope but stands above its midline while the Moving Average Convergence Divergence (MACD) print lower green bars, indicating the the bullish momentum is slowly fading out. That being said, the price trading above the 100 and 20-day Simple Moving Averages (SMAs) suggests that on the bigger picture, the outlook favours the bulls.

Support Levels: $73.55 (100-day SMA), $72.80, $71.90 (20-day SMA).
Resistance Levels:$76.00, $77.00,$77.30 (200-day SMA).

WTI Daily chart

WTI US OIL

Overview
Today last price74.18
Today Daily Change-0.97
Today Daily Change %-1.29
Today daily open75.15
 
Trends
Daily SMA2071.78
Daily SMA5071.55
Daily SMA10073.59
Daily SMA20077
 
Levels
Previous Daily High77.12
Previous Daily Low75.07
Previous Weekly High77.17
Previous Weekly Low72.67
Previous Monthly High74.36
Previous Monthly Low66.95
Daily Fibonacci 38.2%75.85
Daily Fibonacci 61.8%76.34
Daily Pivot Point S174.44
Daily Pivot Point S273.73
Daily Pivot Point S372.38
Daily Pivot Point R176.49
Daily Pivot Point R277.83
Daily Pivot Point R378.55

Author

Patricio Martín

Patricio is an economist from Argentina passionate about global finance and understanding the daily movements of the markets.

More from Patricio Martín
Share:

Editor's Picks

EUR/USD gains traction to near 1.1800 as tariff uncertainty weighs on US Dollar

The EUR/USD pair holds positive ground around 1.1795 during the early Asian session on Tuesday. The US Dollar weakens against the Euro amid US tariff uncertainty. The release of the US January Producer Price Index report will be in the spotlight later on Friday. 

GBP/USD treads water near 1.3500 as BoE-Fed divergence debate stalls

GBP/USD spent Monday spinning in place as market participants await a fresh catalyst to break the pair out of its recent range. The BoE's February hold came with a surprisingly dovish 5-4 split, and UK Consumer Price Index data last week showed inflation easing to 3.0%, reinforcing the case for earlier rate cuts, with most economists now looking to April or March for the next move. 

Gold down but not out as key $5,140 support holds

Gold consolidates the advance to monthly top of $5,250 in Tuesday’s Asian trades. The US Dollar finds demand as liquidity returns and risk sentiment recovers, despite US tariffs uncertainty. Gold defends 61.8% Fibo resistance at $5,142 amid the pullback, daily RSI remains bullish.

Top Crypto Losers: BCH, HYPE, PUMP extend losses as Bitcoin drops below $64,000

Altcoins, including Bitcoin Cash, Hyperliquid, and Pump.fun, are leading losses over the last 24 hours as Bitcoin falls below $64,000 on Tuesday. The technical outlook for BCH, HYPE, and PUMP flags downside risk amid broader market selling.

Supreme Court nixes tariffs, Trump teases 15% global tariff

On February 20th, the Supreme Court ruled that Trump’s global tariffs under IEEPA authority were unconstitutional, effectively nullifying the framework. However, the relief was short-lived. Within hours, Trump floated a 15% blanket tariff under an alternative legal authority.

XRP recovers slightly as bearish sentiment dominates crypto market

Ripple is rising above $1.40 at the time of writing on Monday amid fresh tariff-triggered headwinds in the broader cryptocurrency market. The sell-off to $1.33, the token’s intraday low, can be attributed to macroeconomic uncertainty, geopolitical tensions and risk-averse sentiment among other factors.