- WTI erases gains, returns to the red in the European session.
- Bearish RSI suggests more downside in the offing.
- OPEC+ outcome much-awaited alongside Powell’s speech.
WTI (futures on NYMEX) drops back below $61, shedding over $1 from daily highs of $61.87, as the bulls turn cautious ahead of the all-important outcome from the OPEC and its allies (OPEC+) meeting and Fed Chair Jerome Powell’s critical speech.
The black gold edged higher earlier this Thursday on reports that the alliance is likely to roll over the oil output cuts next month when compared to expectations of production hike, in light of improved global economic outlook.
Meanwhile, markets await Powell’s take on the recent yield surge, which could have a significant impact on the risk sentiment and the US dollar-sensitive oil.
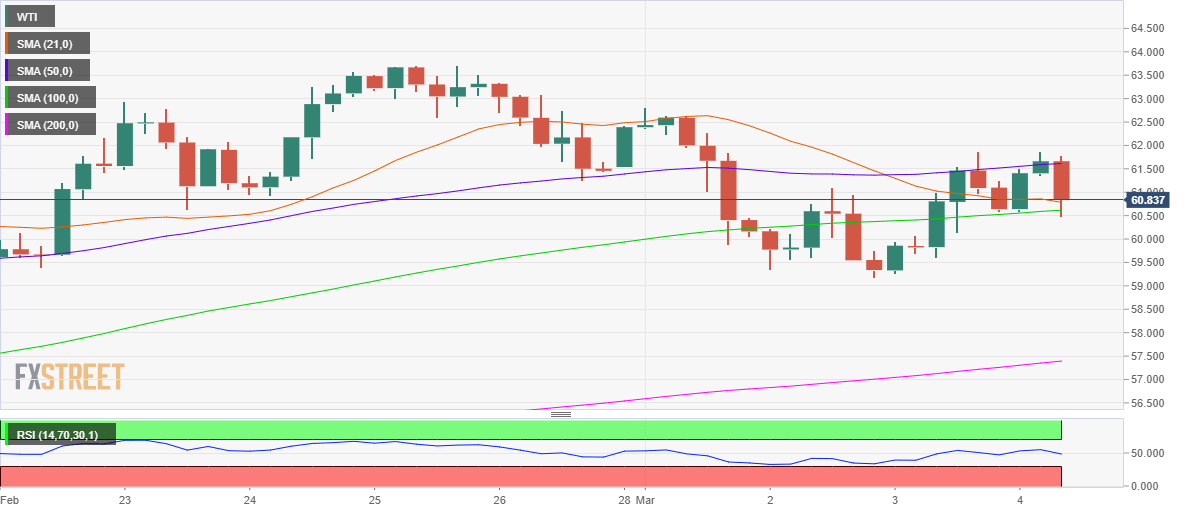
From a technical perspective, the price of the WTI barrel has failed to find acceptance above the horizontal 50-simple moving average (SMA) on the four-hour chart, now at $61.61.
This has prompted the bears to regain control, knocking-off the prices sharply lower to test the fierce support around the $60.65 region. At that level, the bearish 21-SMA coincides with the upward-sloping 100-SMA.
The selling pressure could likely intensify if the black gold delivers a four-hour candlestick closing below the abovementioned cap. Subsequently, a test of the March low at $59.17 cannot be ruled out.
Alternatively, the WTI bulls need a sustained move above the 50-SMA to extending the upside, with the next resistance seen at the $62 round figure.
The Relative Strength Index (RSI) has pierced through the midline and entered the negative territory, suggesting that the downside seems more compelling in the session ahead.
WTI four-hour chart
WTI additional levels
Information on these pages contains forward-looking statements that involve risks and uncertainties. Markets and instruments profiled on this page are for informational purposes only and should not in any way come across as a recommendation to buy or sell in these assets. You should do your own thorough research before making any investment decisions. FXStreet does not in any way guarantee that this information is free from mistakes, errors, or material misstatements. It also does not guarantee that this information is of a timely nature. Investing in Open Markets involves a great deal of risk, including the loss of all or a portion of your investment, as well as emotional distress. All risks, losses and costs associated with investing, including total loss of principal, are your responsibility. The views and opinions expressed in this article are those of the authors and do not necessarily reflect the official policy or position of FXStreet nor its advertisers. The author will not be held responsible for information that is found at the end of links posted on this page.
If not otherwise explicitly mentioned in the body of the article, at the time of writing, the author has no position in any stock mentioned in this article and no business relationship with any company mentioned. The author has not received compensation for writing this article, other than from FXStreet.
FXStreet and the author do not provide personalized recommendations. The author makes no representations as to the accuracy, completeness, or suitability of this information. FXStreet and the author will not be liable for any errors, omissions or any losses, injuries or damages arising from this information and its display or use. Errors and omissions excepted.
The author and FXStreet are not registered investment advisors and nothing in this article is intended to be investment advice.


Recommended content
Editors’ Picks

EUR/USD holds losses near 1.1350 as US Dollar gains on US-China trade optimism
EUR/USD consoldiates losses near 1.1350 in European trading on Friday. Broad US Dollar resurgence on optimism surrounding the US-China trade war de-escalation keeps the he pair undermined. Trade talks and US data remain in focus.

GBP/USD stays pressured near 1.3300 after UK Retail Sales data
GBP/USD remains under moderate selling pressure near 1.3300 despite the upbeat UK Retail Sales data for March. The pair feels the heat of the solid US Dollar rebound, aided by a Bloomberg report, which indicated China may suspend its 125% tariff on select US imports.

Gold price recovers above $3,300 after China denies tariff negotiations
Gold price recovers slightly from the daily low and climbs back above the $3,300 mark in Friday's European session. China's Foreign Ministry denied any ongoing negotiations with the US on tariffs, keeping a lid on the optimism in the markets and lending some support to the safe-haven precious metal.

Ethereum: Accumulation addresses grab 1.11 million ETH as bullish momentum rises
Ethereum saw a 1% decline on Friday as sellers dominated exchange activity in the past 24 hours. Despite the recent selling, increased inflows into accumulation addresses and declining net taker volume show a gradual return of bullish momentum.

Five fundamentals for the week: Traders confront the trade war, important surveys, key Fed speech Premium
Will the US strike a trade deal with Japan? That would be positive progress. However, recent developments are not that positive, and there's only one certainty: headlines will dominate markets. Fresh US economic data is also of interest.

The Best brokers to trade EUR/USD
SPONSORED Discover the top brokers for trading EUR/USD in 2025. Our list features brokers with competitive spreads, fast execution, and powerful platforms. Whether you're a beginner or an expert, find the right partner to navigate the dynamic Forex market.