|

WTI Price Analysis: Sticks to gains near daily peak, comfortably above $71.00 mark

  • WTI regains positive traction, albeit remains well within the previous day’s trading range.
  • The mixed technical setup warrants some caution before placing aggressive directional bets.
  • The 50-day SMA hurdle is likely to act as a pivotal point and holds the key for bullish traders.

Western Texas Intermediate (WTI) Crude Oil prices build on the overnight bounce from a three-day low and gain some positive traction during the Asian session on Wednesday. The commodity, for now, seems to have snapped a two-day losing streak and currently trades around the $71.35-$71.40 region, up just over 0.70% for the day.

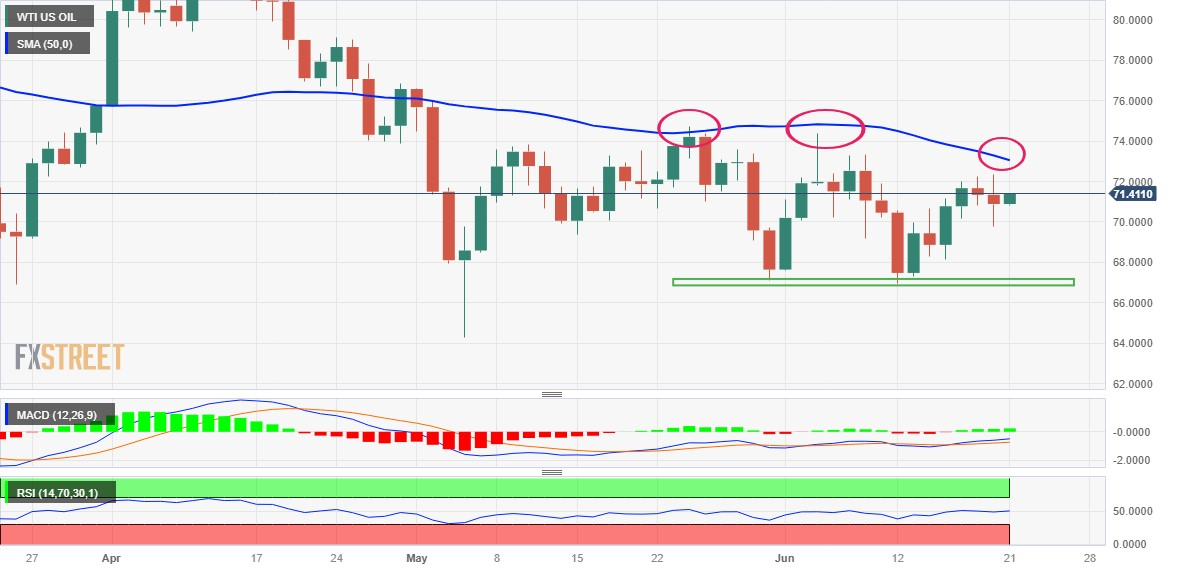
From a technical perspective, the recent bounce from the $67.00 mark constitutes the formation of a bullish double-bottom pattern on the daily chart. That said, oscillators on the said chart have been struggling to gain any meaningful positive traction and warrant some caution before positioning for additional gains. Hence, any subsequent move in Oil prices is likely to confront stiff resistance near the $72.00 round figure, which if cleared might trigger a short-covering rally.

The black liquid might then accelerate the momentum towards challenging the 50-day Simple Moving Average (SMA), currently pegged just above the $72.00 level. A sustained strength beyond will confirm the bullish double-bottom pattern and allow WTI Crude Oil price to reclaim the $74.00 mark. The momentum could get extended further towards the May monthly swing high, around the $74.70  area, which if cleared decisively should set the stage for a further appreciating move.

On the flip side, weakness back below the Asian session low, around the $70.80 area, could drag Crude Oil prices towards the $70.00 psychological mark. The subsequent slide will expose the $69.00 mark before the commodity eventually drops to the $68.25-$68.20 region en route to the $67.60 zone and the $67.00 strong horizontal support. A convincing break below the latter will be seen as a fresh trigger for bearish traders and make the black liquid vulnerable to sliding further.

WTI daily chart

fxsoriginal

Key levels to watch

WTI US OIL

Overview
Today last price71.39
Today Daily Change0.50
Today Daily Change %0.71
Today daily open70.89
 
Trends
Daily SMA2070.96
Daily SMA5073.29
Daily SMA10074.55
Daily SMA20078.03
 
Levels
Previous Daily High72.35
Previous Daily Low69.77
Previous Weekly High72.02
Previous Weekly Low66.95
Previous Monthly High76.61
Previous Monthly Low64.31
Daily Fibonacci 38.2%70.76
Daily Fibonacci 61.8%71.37
Daily Pivot Point S169.66
Daily Pivot Point S268.43
Daily Pivot Point S367.08
Daily Pivot Point R172.23
Daily Pivot Point R273.58
Daily Pivot Point R374.81

Author

Haresh Menghani

Haresh Menghani is a detail-oriented professional with 10+ years of extensive experience in analysing the global financial markets.

More from Haresh Menghani
Share:

Markets move fast. We move first.

Orange Juice Newsletter brings you expert driven insights - not headlines. Every day on your inbox.

By subscribing you agree to our Terms and conditions.

Editor's Picks

EUR/USD clings to small gains near 1.1750

Following a short-lasting correction in the early European session, EUR/USD regains its traction and clings to moderate gains at around 1.1750 on Monday. Nevertheless, the pair's volatility remains low, with investors awaiting this weeks key data releases from the US and the ECB policy announcements.

GBP/USD edges higher toward 1.3400 ahead of US data and BoE

GBP/USD reverses its direction and advances toward 1.3400 following a drop to the 1.3350 area earlier in the day. The US Dollar struggles to gather recovery momentum as markets await Tuesday's Nonfarm Payrolls data, while the Pound Sterling holds steady ahead of the BoE policy announcements later in the week.

Gold pulls away from session high, holds above $4,300

Gold loses its bullish momentum and retreats below $4,350 after testing this level earlier on Monday. XAU/USD, however, stays in positive territory as the US Dollar remains on the back foot on growing expectations for a dovish Fed policy outlook next year.

Solana consolidates as spot ETF inflows near $1 billion signal institutional dip-buying

Solana price hovers above $131 at the time of writing on Monday, nearing the upper boundary of a falling wedge pattern, awaiting a decisive breakout. On the institutional side, demand for spot Solana Exchange-Traded Funds remained firm, pushing total assets under management to nearly $1 billion since launch. 

Big week ends with big doubts

The S&P 500 continued to push higher yesterday as the US 2-year yield wavered around the 3.50% mark following a Federal Reserve (Fed) rate cut earlier this week that was ultimately perceived as not that hawkish after all. The cut is especially boosting the non-tech pockets of the market.

Solana Price Forecast: SOL consolidates as spot ETF inflows near $1 billion signal institutional dip-buying

Solana (SOL) price hovers above $131 at the time of writing on Monday, nearing the upper boundary of a falling wedge pattern, awaiting a decisive breakout.