- WTI takes offers to refresh intraday low, snaps four-day uptrend.
- RSI’s retreat from overbought territory, sluggish MACD favor latest declines.
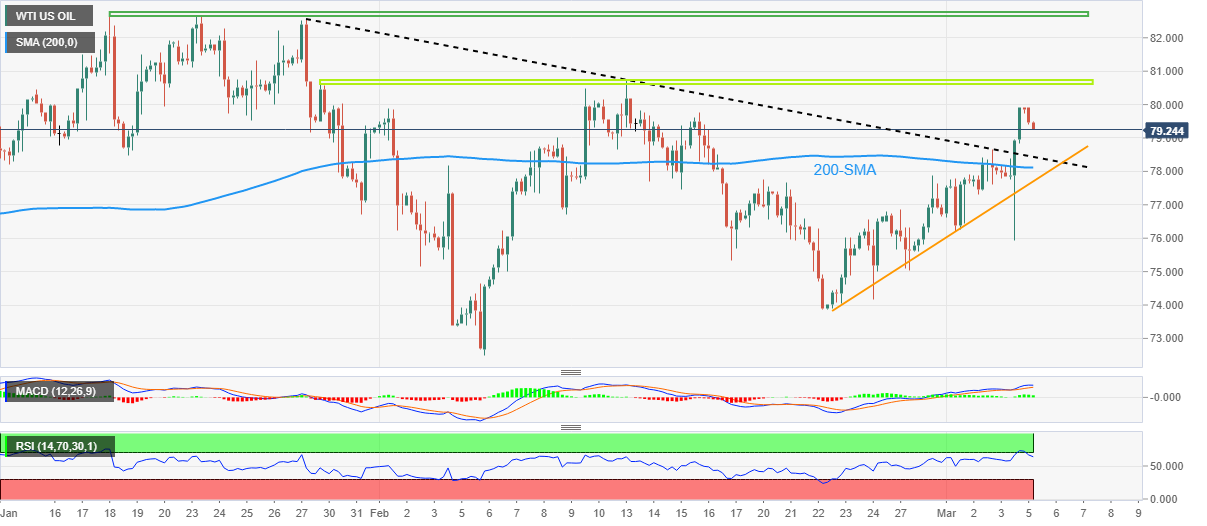
- Five-week-old previous resistance, 200-SMA restrict short-term downside moves.
- Oil bulls have a bumpy road to travel in case of fresh recovery.
WTI crude oil returns to the bear’s radar, after a four-day winning streak, as the energy benchmark takes a U-turn from a three-week high to print 0.70% intraday losses around $79.30 during early Monday.
In doing so, the black gold traces the RSI (14) as it reverses from the overbought territory. However, the sluggish MACD signals hint at the lack of momentum and hence challenge the Oil bears.
Additionally testing the commodity’s latest weakness could be a downward-sloping support line from January 27, previous resistance around $78.45.
Even if the WTI bears manage to conquer resistance-turned-support of near $78.45, the 200-SMA and an ascending support line from late February, respectively near $78.10 and $77.70, could restrict the quote’s further downside before convincing the sellers.
Meanwhile, recovery moves may initially aim for the $80.00 psychological magnet before targeting the five-week-long horizontal resistance area surrounding $80.65-70.
Following that, a horizontal resistance zone comprising tops marked since January 18, close to $82.65-70, could challenge the WTI bulls before giving them control.
Overall, WTI crude oil is likely to witness further downside but the bears need to remain cautious unless witnessing a clear break of the $77.70.
WTI: Four-hour chart
Trend: Limited downside expected
Information on these pages contains forward-looking statements that involve risks and uncertainties. Markets and instruments profiled on this page are for informational purposes only and should not in any way come across as a recommendation to buy or sell in these assets. You should do your own thorough research before making any investment decisions. FXStreet does not in any way guarantee that this information is free from mistakes, errors, or material misstatements. It also does not guarantee that this information is of a timely nature. Investing in Open Markets involves a great deal of risk, including the loss of all or a portion of your investment, as well as emotional distress. All risks, losses and costs associated with investing, including total loss of principal, are your responsibility. The views and opinions expressed in this article are those of the authors and do not necessarily reflect the official policy or position of FXStreet nor its advertisers. The author will not be held responsible for information that is found at the end of links posted on this page.
If not otherwise explicitly mentioned in the body of the article, at the time of writing, the author has no position in any stock mentioned in this article and no business relationship with any company mentioned. The author has not received compensation for writing this article, other than from FXStreet.
FXStreet and the author do not provide personalized recommendations. The author makes no representations as to the accuracy, completeness, or suitability of this information. FXStreet and the author will not be liable for any errors, omissions or any losses, injuries or damages arising from this information and its display or use. Errors and omissions excepted.
The author and FXStreet are not registered investment advisors and nothing in this article is intended to be investment advice.


Recommended content
Editors’ Picks

AUD/USD: A challenge of the 2025 peaks looms closer
AUD/USD rose further, coming closer to the key resistance zone around 0.6400 despite the strong rebound in the Greenback and the mixed performance in the risk-associated universe. The pair’s solid price action was also propped up by a firm jobs report in Oz.

EUR/USD: Extra gains likely above 1.1400
EUR/USD came under renewed downside pressure following another bull run to the 1.1400 region on Thursday. The knee-jerk in spot came in response to the decent bounce in the US Dollar, while the dovish tone from the ECB’s Lagarde seems to have also contributed to the bearish developments in the pair.

Gold bounces off daily lows, back near $3,320
The prevailing risk-on mood among traders challenges the metal’s recent gains and prompts a modest knee-jerk in its prices on Thursday. After bottoming out near the $3,280 zone per troy ounce, Gold prices are now reclaiming the $3,320 area in spite of the stronger Greenback.

Canada launches world's first Solana ETF as $270M in staking deposits propel SOL price above BTC and ETH
Solana price jumps on Thursday as Canadian firm launches the world’s first SOL ETF, fueling bullish sentiment alongside $270 million in new staking deposits this week.

Future-proofing portfolios: A playbook for tariff and recession risks
It does seem like we will be talking tariffs for a while. And if tariffs stay — in some shape or form — even after negotiations, we’ll likely be talking about recession too. Higher input costs, persistent inflation, and tighter monetary policy are already weighing on global growth.

The Best brokers to trade EUR/USD
SPONSORED Discover the top brokers for trading EUR/USD in 2025. Our list features brokers with competitive spreads, fast execution, and powerful platforms. Whether you're a beginner or an expert, find the right partner to navigate the dynamic Forex market.