|

WTI Price Analysis: Remains confined in multi-day-old trading range, bulls have the upper hand

  • WTI Crude Oil prices extend the sideways consolidative price move on the first day of a new week.
  • The setup favours bulls and supports prospects for a breakout through a one-week-old trading range.
  • A break below the trading range support will expose last week's swing low, around $84.60-$84.55.

Western Texas Intermediate (WTI) Crude Oil prices ticks lower during the Asian session on Monday, albeit lack follow-through selling and currently hover around mid-$86.00s, down nearly 0.20% for the day.

Looking at the broader picture, the black liquid remains confined in a familiar trading band held over the past week or so. The prospects of tighter global supplies, along with hopes for a demand recovery in China, continue to act as a tailwind for WTI Crude Oil prices. Apart from this, a modest US Dollar (USD) retracement slide, from a six-month peak touched last week, turns out to be another factor lending some support to the USD-denominated commodity.

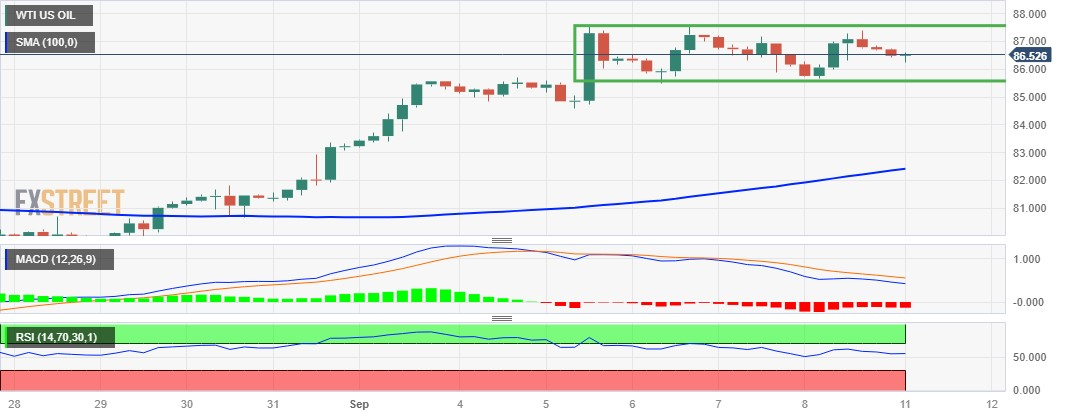
From a technical perspective, the range-bound price action comes on the back of the recent rally to the highest level since mid-November and might be categorized as a bullish consolidation phase. This, along with bullish oscillators, suggests that the path of least resistance for WTI Crude Oil prices is to the upside. That said, the Relative Strength Index (RSI) on the daily chart is placed near the overbought territory and holding back bulls from placing fresh bets.

Hence, it will be prudent to wait for a convincing breakout through the trading range resistance, around the $87.55 region, before positioning for any further gains. WTI Crude Oil prices might then accelerate the momentum towards the $88.00 round figure en route to the $88.60 intermediate hurdle, the $89.00 mark and the next relevant barrier near the $89.30-$89.35 zone.

On the flip side, the $86.00 round figure could protect the immediate downside ahead of the $85.60-$85.50 area, representing the lower boundary of the aforementioned trading range. A convincing break below might prompt some technical selling and pave the way for some meaningful corrective decline. The subsequent downfall might then drag WTI Crude Oil prices below the $85.00 psychological mark, towards last week's swing low, around the $84.60-$84.55 region.

WTI 4-hour chart

fxsoriginal

Technical levels to watch

WTI US OIL

Overview
Today last price86.54
Today Daily Change-0.17
Today Daily Change %-0.20
Today daily open86.71
 
Trends
Daily SMA2082.09
Daily SMA5079.42
Daily SMA10075.5
Daily SMA20076.22
 
Levels
Previous Daily High87.38
Previous Daily Low85.66
Previous Weekly High87.56
Previous Weekly Low84.58
Previous Monthly High84.32
Previous Monthly Low77.53
Daily Fibonacci 38.2%86.72
Daily Fibonacci 61.8%86.32
Daily Pivot Point S185.79
Daily Pivot Point S284.86
Daily Pivot Point S384.06
Daily Pivot Point R187.51
Daily Pivot Point R288.31
Daily Pivot Point R389.23

Author

Haresh Menghani

Haresh Menghani is a detail-oriented professional with 10+ years of extensive experience in analysing the global financial markets.

More from Haresh Menghani
Share:

Markets move fast. We move first.

Orange Juice Newsletter brings you expert driven insights - not headlines. Every day on your inbox.

By subscribing you agree to our Terms and conditions.

Editor's Picks

EUR/USD clings to small gains near 1.1750

Following a short-lasting correction in the early European session, EUR/USD regains its traction and clings to moderate gains at around 1.1750 on Monday. Nevertheless, the pair's volatility remains low, with investors awaiting this weeks key data releases from the US and the ECB policy announcements.

GBP/USD edges higher toward 1.3400 ahead of US data and BoE

GBP/USD reverses its direction and advances toward 1.3400 following a drop to the 1.3350 area earlier in the day. The US Dollar struggles to gather recovery momentum as markets await Tuesday's Nonfarm Payrolls data, while the Pound Sterling holds steady ahead of the BoE policy announcements later in the week.

Gold pulls away from session high, holds above $4,300

Gold loses its bullish momentum and retreats below $4,330 after testing $4,350 on Monday. XAU/USD, however, stays in positive territory as the US Dollar remains on the back foot on growing expectations for a dovish Fed policy outlook next year.

Solana consolidates as spot ETF inflows near $1 billion signal institutional dip-buying

Solana price hovers above $131 at the time of writing on Monday, nearing the upper boundary of a falling wedge pattern, awaiting a decisive breakout. On the institutional side, demand for spot Solana Exchange-Traded Funds remained firm, pushing total assets under management to nearly $1 billion since launch. 

Big week ends with big doubts

The S&P 500 continued to push higher yesterday as the US 2-year yield wavered around the 3.50% mark following a Federal Reserve (Fed) rate cut earlier this week that was ultimately perceived as not that hawkish after all. The cut is especially boosting the non-tech pockets of the market.

Solana Price Forecast: SOL consolidates as spot ETF inflows near $1 billion signal institutional dip-buying

Solana (SOL) price hovers above $131 at the time of writing on Monday, nearing the upper boundary of a falling wedge pattern, awaiting a decisive breakout.