|

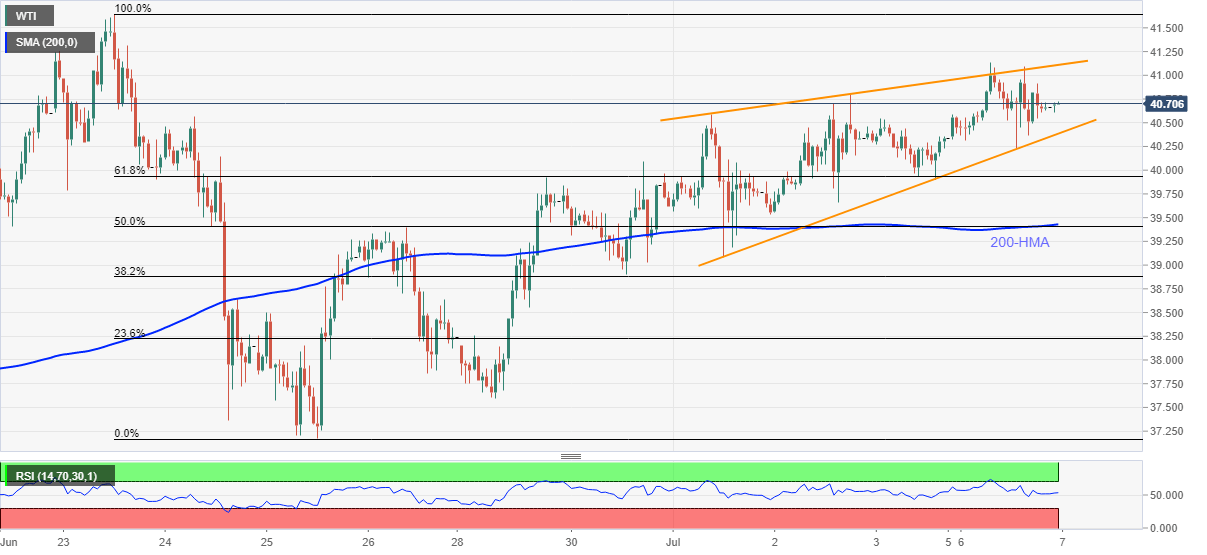
WTI Price Analysis: Prints rising wedge on hourly chart beyond $40.00

  • WTI eases from $40.72 during the initial hour of trading.
  • Repeated failures to stay positive beyond $41.00 keep sellers hopeful.
  • A confirmation of the bearish chart pattern highlights $39.40 support confluence.

WTI slips from $40.72 to $40.63 during the early Asian session on Tuesday. The black gold refreshed a two-week high the previous day but marked another pullback from $41.00. In doing so, the energy benchmark portrays a bearish formation, rising wedge, on the hourly chart.

Given the quote’s multiple U-turns from $41.00, coupled with a downside suggesting chart pattern, sellers await a clear break below $40.36 to take fresh entries.

Following a sustained trading past-$40.36, a confluence of 200-HMA and 50% Fibonacci retracement of June 23-25 fall, around $39.40, will be in the spotlight.

Should there be a clear downside below $39.40, June 24 top near $38.60 and June 24 low near $37.60 might offer intermediate halts before dragging oil prices to the previous month’s bottom close to $34.50/45.

Meanwhile, the mentioned bearish formation’s upper line around $41.15 can offer immediate resistance ahead of June month’s top near $41.65.

It should, however, be noted that the bulls’ ability to cross $41.65 enables them to challenge February month low around $44.00.

WTI hourly chart

Trend: Pullback expected

Additional important levels

Overview
Today last price40.69
Today Daily Change0.35
Today Daily Change %0.87%
Today daily open40.34
 
Trends
Daily SMA2038.87
Daily SMA5032.94
Daily SMA10033.39
Daily SMA20044.97
 
Levels
Previous Daily High40.54
Previous Daily Low39.9
Previous Weekly High40.8
Previous Weekly Low37.6
Previous Monthly High41.65
Previous Monthly Low34.45
Daily Fibonacci 38.2%40.3
Daily Fibonacci 61.8%40.15
Daily Pivot Point S139.98
Daily Pivot Point S239.62
Daily Pivot Point S339.34
Daily Pivot Point R140.62
Daily Pivot Point R240.9
Daily Pivot Point R341.26

Author

Anil Panchal

Anil Panchal

FXStreet

Anil Panchal has nearly 15 years of experience in tracking financial markets. With a keen interest in macroeconomics, Anil aptly tracks global news/updates and stays well-informed about the global financial moves and their implications.

More from Anil Panchal
Share:

Editor's Picks

EUR/USD stays depressed near 1.1850 ahead of German ZEW

EUR/USD remains in the red near 1.1850 in the European session on Tuesday. A broad US Dollar bullish consolidation combined with a softer risk tone keep the pair undermined ahead of the German ZEW sentiment survey. 

GBP/USD drops below 1.3600 after weak UK jobs report

GBP/USD is seeing a fresh selling wave, giving up the 1.3600 level in Tuesday's European trading. The United Kingdom employment data showed worsening labor market conditions, bolstering bets for a BoE interest rate cut next month. This narrative is weighing heavily on the Pound Sterling. 

Gold adds to intraday losses as risk-on mood offsets dovish Fed and subdued USD demand

Gold attracts some follow-through selling for the second straight day and dives to over a one-week low, around the $4,858 area, heading into the European session on Tuesday. The commodity, however, quickly recovers to the $4,900 mark as traders opt to await more cues about the US Federal Reserve's (Fed) rate-cut path before placing fresh directional bets.

Pi Network rallies ahead of its first anniversary

Pi Network trades above $0.1800 at the time of writing on Tuesday, recording nearly 5% gains so far. On-chain data indicate that large wallet investors, commonly known as whales, have accumulated approximately 4 million PI tokens over the last 24 hours.

The week ahead: Key inflation readings and why the AI trade could be overdone

It is likely to be a quiet start to the week, with US markets closed on Monday for Presidents Day. European markets are higher across the board and gold is clinging to the $5,000 level after the tamer than expected CPI report in the US reduced haven flows to precious metals.

Stellar mixed sentiment caps recovery

Stellar price remains under pressure, trading at $0.170 on Tuesday after failing to close above the key resistance on Sunday. The derivatives metric supports the bearish sentiment, with XLM’s short bets rising among traders and funding rates turning negative.