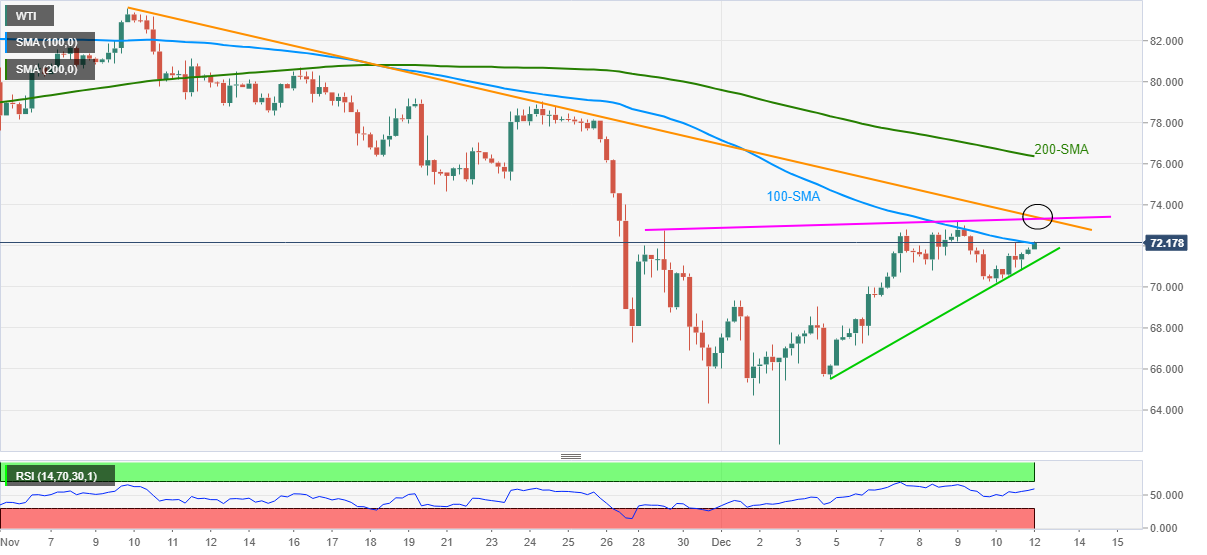
WTI Price Analysis: Pokes 100-SMA on the way to $73.50 key resistance
- WTI remains on the front foot after marking the best week since late August.
- Firmer RSI, sustained bounce off weekly support line keeps buyers hopeful.
- Two resistance lines from November guard immediate upside ahead of 200-SMA.

WTI rises 0.52% intraday while piecing the $72.00 threshold during Monday’s Asian session.
The black gold jumped the most on a weekly basis in over three months at the latest by keeping the rebound from a short-term support line. Adding to the bullish bias is the RSI line that stays firmer but not overbought, suggesting the market’s acceptance of the recent recovery.
That said, a clear break of the 100-SMA directs WTI towards a convergence of an ascending trend line from November 29 and a five-week-old downward sloping resistance line, around $73.50.
Should the oil buyers manage to cross the $73.50 hurdle, the 200-SMA level of $76.40 will act as a buffering the run-up targeting November 24 highs near $79.00 and the $80.00 threshold.
In a case where the WTI bulls step back, the stated support line from December 03, around $71.20 by the press time, will restrict short-term declines.
Following that, multiple supports near $70.30 and the $70.00 psychological magnet can entertain the bears before convincing them to knock $69.00 support, which holds the key for the quote’s further weakness.
WTI: Four-hour chart
Trend: Further upside expected
Author

Anil Panchal
FXStreet
Anil Panchal has nearly 15 years of experience in tracking financial markets. With a keen interest in macroeconomics, Anil aptly tracks global news/updates and stays well-informed about the global financial moves and their implications.


