|

WTI Price Analysis: On the bids near yearly top above $54.00, OPEC in focus

  • WTI stays positive while flirting with February 2020 top.
  • Overbought RSI conditions probe bullish chart formation around nearby resistance.
  • 21-day SMA, channel support close adjacent doors for seller’s entry.
  • Headlines from OPEC meeting will be the key to follow.

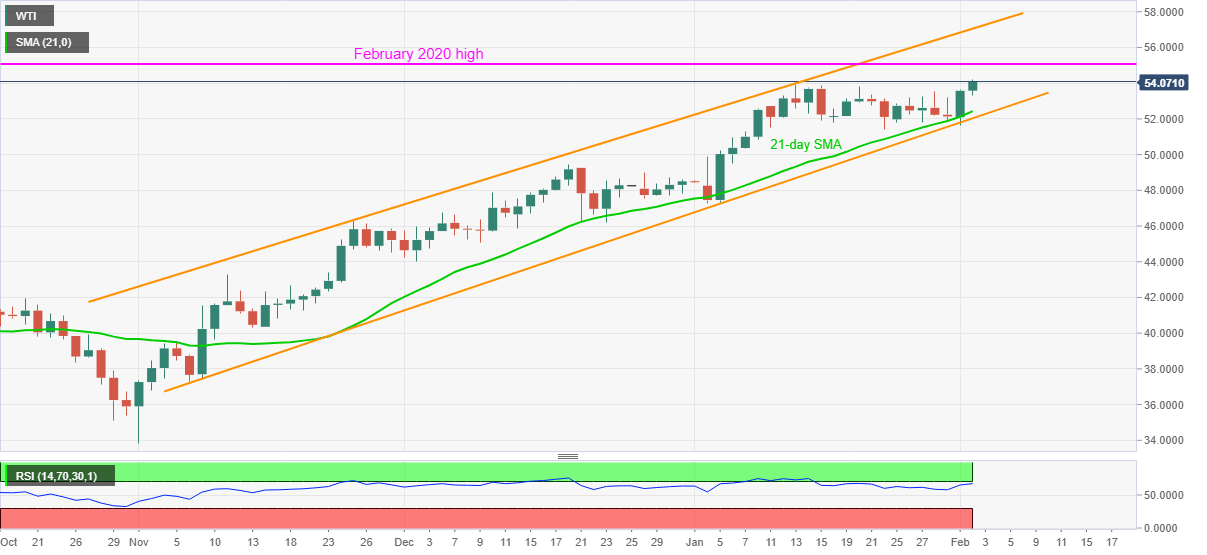
Having recently bounced off $53.96, WTI teases the intraday high around $54.25, also the highest since February 2020, while heading into Tuesday’s European session.  In doing so, the oil benchmark justifies the previous day’s recovery moves from 21-day SMA and an ascending trend channel’s support ranging from November 2020.

Although bulls are in full mood, overbought RSI conditions may trigger pullback around February 2020 peak surrounding $54.70.

In a case where the oil buyers keep dominating past-$54.70, the $55.00 round-figure may offer an intermediate halt to the rally targeting the mid-January 2020 lows near $57.40.

On the flip side, a daily closing below the 21-day SMA level of $52.43 needs validation from the stated channel support, currently around $52.00, to convince the WTI sellers.

If at all the anticipated pullback extends below $52.00, December 2020 tops near $49.40 should return to the charts. Though, the $50.00 threshold can offer an intermediate halt during the fall.

Overall, oil prices remain strong and eye early 2020 levels. However, today’s OPEC meeting may trigger the much-awaited pullback in case of negative surprises.

WTI daily chart

Trend: Bullish

Additional important levels

Overview
Today last price54.17
Today Daily Change0.60
Today Daily Change %1.12%
Today daily open53.57
 
Trends
Daily SMA2052.36
Daily SMA5049.1
Daily SMA10044.57
Daily SMA20040.97
 
Levels
Previous Daily High53.65
Previous Daily Low51.6
Previous Weekly High53.51
Previous Weekly Low51.8
Previous Monthly High53.94
Previous Monthly Low47.26
Daily Fibonacci 38.2%52.87
Daily Fibonacci 61.8%52.39
Daily Pivot Point S152.23
Daily Pivot Point S250.89
Daily Pivot Point S350.18
Daily Pivot Point R154.28
Daily Pivot Point R254.99
Daily Pivot Point R356.33

Author

Anil Panchal

Anil Panchal

FXStreet

Anil Panchal has nearly 15 years of experience in tracking financial markets. With a keen interest in macroeconomics, Anil aptly tracks global news/updates and stays well-informed about the global financial moves and their implications.

More from Anil Panchal
Share:

Editor's Picks

EUR/USD eyes nine-day EMA barrier after rebounding from 1.1600

EUR/USD gains ground after registering modest losses in the previous session, trading around 1.1620 during the Asian hours on Friday. The technical analysis of the daily chart suggests an ongoing bearish bias as the pair remains within the descending channel pattern.

GBP/USD drifts lower heading into NFP range

GBP/USD edged lower by 0.2% on Thursday, settling close to 1.3350 in a strained trading session that kept the pair pinned near three-month lows. Price briefly recovered earlier in the day on reports that Iran had indirectly signaled openness to talks with the CIA, but the bounce faded as Israeli officials reportedly advised Washington to disregard the overture. 

Gold recovers above $5,100 ahead of US NFP report

Gold price jumps back above $5,100 in the Asian session on Friday. The precious metal regains traction, helped by a fresh bout of US Dollar selling and persisting risk-off flows. The US employment report for February will take center stage later on Friday. 

Ethereum pull in $169M as validators pile in to stake ETH

US spot Ethereum exchange-traded funds recorded $169 million in net inflows on Wednesday, marking the largest daily intake in two months, according to SoSoValue data. The rise in inflows signals renewed institutional interest in Ethereum amid broader market volatility.

The market compass is pointing at a barrel of Oil

The Asian open is arriving with equities leaning the wrong way, and the reason is not complicated. The market’s compass needle has snapped firmly toward crude. In this tape, oil is not just another input price; it is the gravitational center around which every asset class is orbiting.

Ripple tests recovery strength amid steady ETF inflows, growing retail interest

Ripple (XRP) continues to demonstrate notable resilience as the cryptocurrency market navigates the persistent war in the Middle East after the United States (US) and Israel attacked Iran on Saturday.