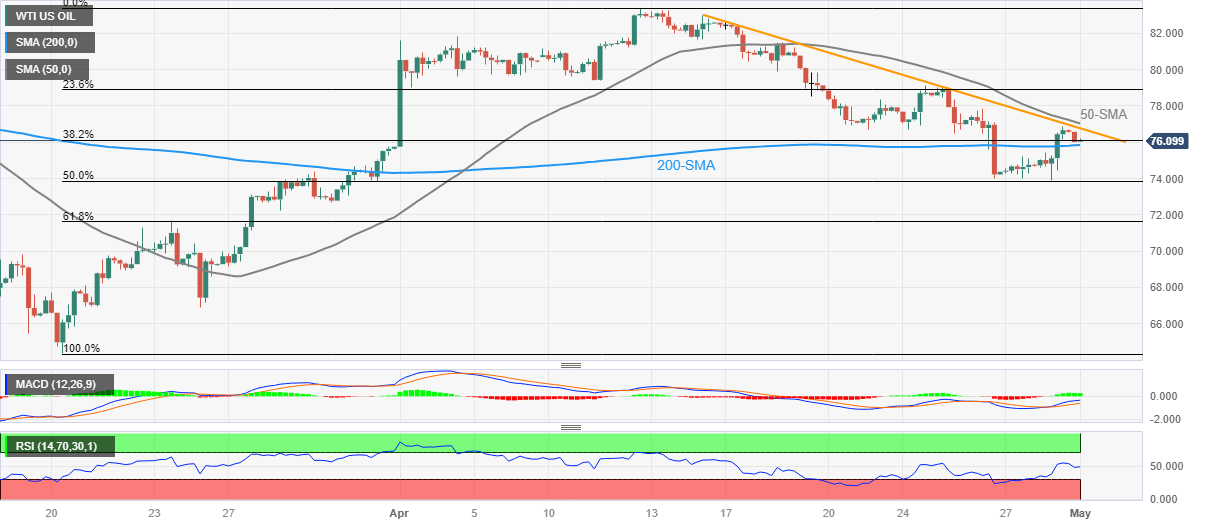
- WTI crude oil snaps two-day winning streak, holds lower ground near intraday bottom.
- Fortnight-old descending resistance line, 50-SMA restrict immediate upside.
- 200-SMA, 50% Fibonacci retracement limit nearby downside as bears take a breather.
WTI crude oil retreats to $76.00 as it fades the previous day’s corrective bounce off 50% Fibonacci retracement of the March-April uptrend amid early Monday. In doing so, the black gold retreats from a two-week-old falling trend line and the 50-SMA. Adding strength to the downside bias is the steady RSI (14) line.
However, the 200-SMA level of around $75.85 and bullish MACD signals challenge the energy benchmark buyers.
That said, the quote’s weakness past $75.85 needs validation from the 50% Fibonacci retracement level of around $73.85 and the late March swing low of around $72.70 to convince the Oil bears.
Following that, the WTI crude oil price can approach the 61.8% Fibonacci retracement level, also known as the golden Fibonacci ratio, to act as the last defense for the Oil buyers.
On the flip side, the aforementioned immediate descending resistance line and the 50-SMA, respectively near $76.80 and $77.10, can challenge short-term Oil buyers.
Even so, multiple levels near $79.50, the $80.00 round figure and $81.60 can prod the WTI bulls before directing them to the latest multi-day peak of $83.40, marked in April.
To sum up, WTI crude oil price is likely to remain on the bull’s radar unless staying below $72.70.
WTI crude oil: Four-hour chart
Trend: Limited downside expected
Information on these pages contains forward-looking statements that involve risks and uncertainties. Markets and instruments profiled on this page are for informational purposes only and should not in any way come across as a recommendation to buy or sell in these assets. You should do your own thorough research before making any investment decisions. FXStreet does not in any way guarantee that this information is free from mistakes, errors, or material misstatements. It also does not guarantee that this information is of a timely nature. Investing in Open Markets involves a great deal of risk, including the loss of all or a portion of your investment, as well as emotional distress. All risks, losses and costs associated with investing, including total loss of principal, are your responsibility. The views and opinions expressed in this article are those of the authors and do not necessarily reflect the official policy or position of FXStreet nor its advertisers. The author will not be held responsible for information that is found at the end of links posted on this page.
If not otherwise explicitly mentioned in the body of the article, at the time of writing, the author has no position in any stock mentioned in this article and no business relationship with any company mentioned. The author has not received compensation for writing this article, other than from FXStreet.
FXStreet and the author do not provide personalized recommendations. The author makes no representations as to the accuracy, completeness, or suitability of this information. FXStreet and the author will not be liable for any errors, omissions or any losses, injuries or damages arising from this information and its display or use. Errors and omissions excepted.
The author and FXStreet are not registered investment advisors and nothing in this article is intended to be investment advice.
Recommended content
Editors’ Picks

AUD/USD stays firm near 0.6300 amid modest risk appetite
AUD/USD is posting small gains near 0.6300 in early Asian trades on Monday, opening the week on the front foot. Risk sentiment remains in a sweeter spot following the weekend's news of lower US tariffs on Chinese electronic supply chain. Tariffs talks will remain on the radar.

USD/JPY faces intense supply, falls back to 142.50
USD/JPY has erased early gains to trade deep in the red near 142.50 in Monday's Asian trading. The US Dollar resumes its downside toward multi-year troughs, digesting Trump's tariff news from the weekend. The Fed-BoJ policy divergence expectations underpin the Japanese Yen, weighing on the pair.

Gold retreats from record highs of $3,245 as US Dollar finds its feet
Gold is rereating from record highs of $3,245 early Monday, extending Friday's late pullback. Reducded demand for safe-havens and a broad US Dollar rebound undermine the yellow metal amid the news of not-so-steep US tariffs on China's semiconductors and electronics.

Week ahead: ECB set to cut, BoC might pause as Trump U-turns on tariffs
ECB is expected to trim rates, but the BoC might pause this time. CPI data also in the spotlight; due in UK, Canada, New Zealand and Japan. Retail sales the main release in the United States. China GDP eyed as Beijing not spared by Trump.

Is a recession looming?
Wall Street skyrockets after Trump announces tariff delay. But gains remain limited as Trade War with China continues. Recession odds have eased, but investors remain fearful. The worst may not be over, deeper market wounds still possible.

The Best brokers to trade EUR/USD
SPONSORED Discover the top brokers for trading EUR/USD in 2025. Our list features brokers with competitive spreads, fast execution, and powerful platforms. Whether you're a beginner or an expert, find the right partner to navigate the dynamic Forex market.


