|

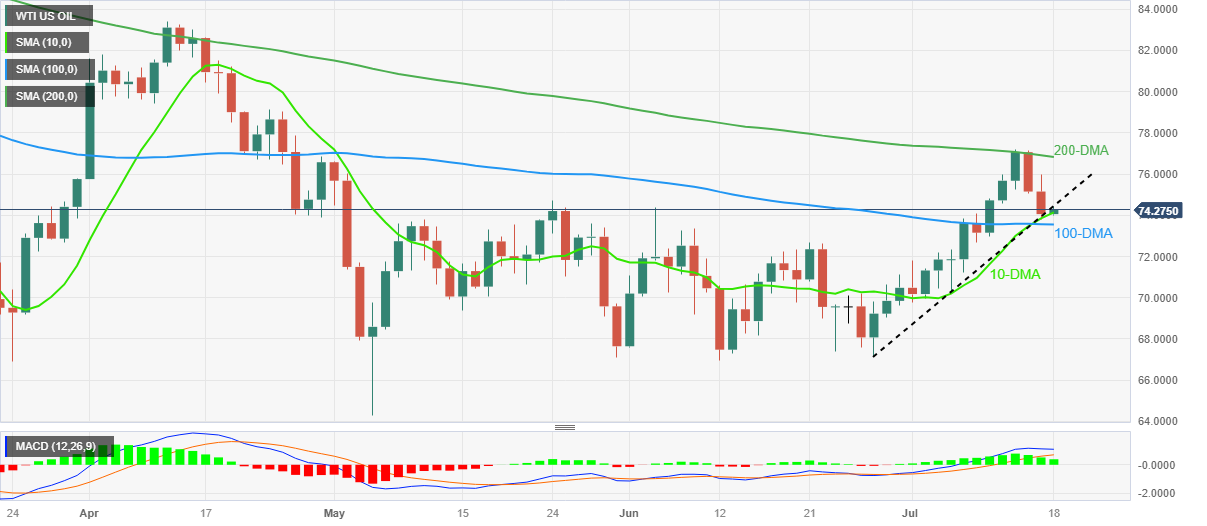
WTI Price Analysis: Oil bounces off 10-DMA to snap two-day losing streak above $74.00

  • WTI crude oil price grinds near intraday high during the first profit-making day in three.
  • Bullish MACD signals favor commodity’s bounce off 10-DMA but three-week-old previous support line prods energy buyers.
  • 100-DMA acts as additional downside support while 200-DMA appears a tough nut to crack for WTI bulls.

WTI crude oil clings to mild gains around $74.30, up 0.33% intraday heading into Tuesday’s European session, as it rebounds from the 10-DMA support to print the first daily gain in three.

Apart from the 10-DMA support, the bullish MACD signals also underpin the upside bias surrounding the Oil price.

However, the support-turned-resistance line stretched from late June, around $74.40 by the press time, guards the immediate upside of the black gold price.

Following that, the $75.00 and the $76.00 round figures may entertain the buyers of the energy benchmark before highlighting the 200-DMA hurdle of $76.85. Also acting as an upside filter is the monthly high of near $77.20.

It’s worth noting that the late April swing high of near $79.20 and the $80.00 threshold will also challenge the Oil buyers before giving them control.

Alternatively, a daily closing beyond the 10-DMA support of around $74.10 will need validation from the $74.00 psychological mark and the 100-DMA, near $73.50 at the latest.

In a case where the WTI bears keep the reins past $73.50, June’s high of near $72.70 and the $70.00 will be in the spotlight.

To sum up, the WTI crude oil is likely to remain firmer but the road toward the north is bumpier than the south.

WTI: Daily chart

Trend: Limited upside expected

additional important levels

Overview
Today last price74.28
Today Daily Change0.22
Today Daily Change %0.30%
Today daily open74.06
 
Trends
Daily SMA2071.91
Daily SMA5071.57
Daily SMA10073.56
Daily SMA20076.91
 
Levels
Previous Daily High76
Previous Daily Low73.78
Previous Weekly High77.17
Previous Weekly Low72.67
Previous Monthly High74.36
Previous Monthly Low66.95
Daily Fibonacci 38.2%74.63
Daily Fibonacci 61.8%75.15
Daily Pivot Point S173.23
Daily Pivot Point S272.4
Daily Pivot Point S371.01
Daily Pivot Point R175.44
Daily Pivot Point R276.83
Daily Pivot Point R377.66

Author

Anil Panchal

Anil Panchal

FXStreet

Anil Panchal has nearly 15 years of experience in tracking financial markets. With a keen interest in macroeconomics, Anil aptly tracks global news/updates and stays well-informed about the global financial moves and their implications.

More from Anil Panchal
Share:

Markets move fast. We move first.

Orange Juice Newsletter brings you expert driven insights - not headlines. Every day on your inbox.

By subscribing you agree to our Terms and conditions.

Editor's Picks

EUR/USD clings to small gains near 1.1750

Following a short-lasting correction in the early European session, EUR/USD regains its traction and clings to moderate gains at around 1.1750 on Monday. Nevertheless, the pair's volatility remains low, with investors awaiting this weeks key data releases from the US and the ECB policy announcements.

GBP/USD edges higher toward 1.3400 ahead of US data and BoE

GBP/USD reverses its direction and advances toward 1.3400 following a drop to the 1.3350 area earlier in the day. The US Dollar struggles to gather recovery momentum as markets await Tuesday's Nonfarm Payrolls data, while the Pound Sterling holds steady ahead of the BoE policy announcements later in the week.

Gold pulls away from session high, holds above $4,300

Gold loses its bullish momentum and retreats below $4,350 after testing this level earlier on Monday. XAU/USD, however, stays in positive territory as the US Dollar remains on the back foot on growing expectations for a dovish Fed policy outlook next year.

Solana consolidates as spot ETF inflows near $1 billion signal institutional dip-buying

Solana price hovers above $131 at the time of writing on Monday, nearing the upper boundary of a falling wedge pattern, awaiting a decisive breakout. On the institutional side, demand for spot Solana Exchange-Traded Funds remained firm, pushing total assets under management to nearly $1 billion since launch. 

Big week ends with big doubts

The S&P 500 continued to push higher yesterday as the US 2-year yield wavered around the 3.50% mark following a Federal Reserve (Fed) rate cut earlier this week that was ultimately perceived as not that hawkish after all. The cut is especially boosting the non-tech pockets of the market.

Solana Price Forecast: SOL consolidates as spot ETF inflows near $1 billion signal institutional dip-buying

Solana (SOL) price hovers above $131 at the time of writing on Monday, nearing the upper boundary of a falling wedge pattern, awaiting a decisive breakout.