- WTI stays on the back foot for the fourth consecutive day.
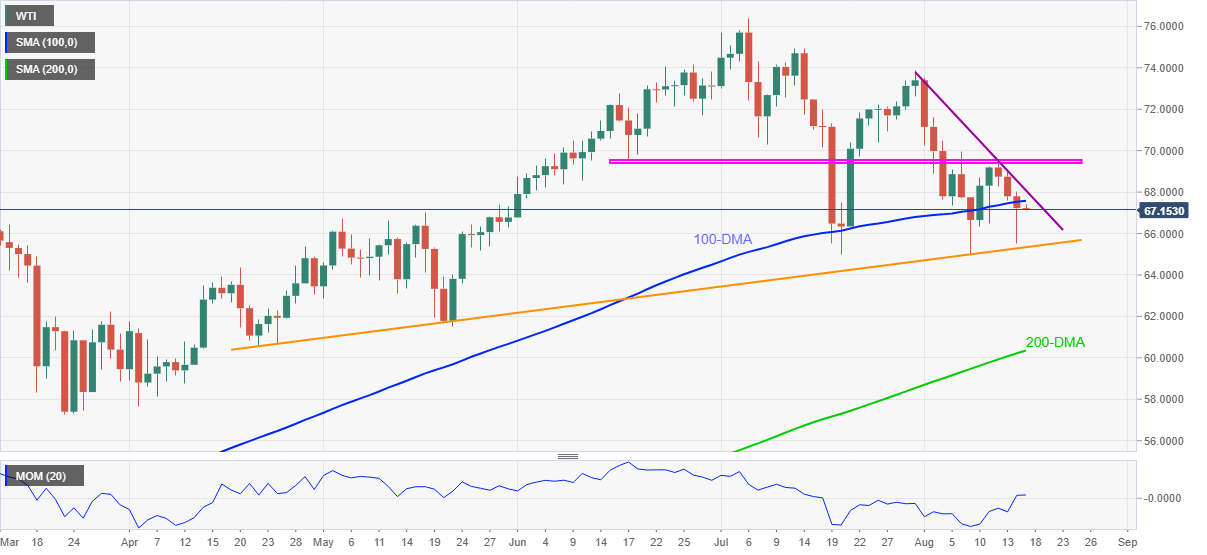
- A daily closing below 100-DMA, firmer bearish Momentum favor sellers.
- 200-DMA will follow the trend line support, monthly falling trend line adds to the upside filters.
WTI takes offers around $67.17, down 0.10% intraday, during Tuesday’s Asian session. In doing so, the black gold drops for the fourth consecutive day towards an ascending trend line from late April.
Given the quote’s daily closing below 100-DMA amid a firmer Momentum line, the black gold prices are likely to remain pressured towards the key support line near $65.30.
However, a daily closing below $65.30 will make the commodity prices vulnerable to test the 200-DMA level of $60.35 and the $60.00 psychological magnet.
During the fall, the monthly low and May’s bottom, respectively around $65.00 and $61.50, could offer intermediate halts.
On the flip side, a sustained break of the 100-DMA level of $67.60 will direct the WTI prices towards a downward sloping trend line from July 30, near $68.10.
If at all, the oil buyers manage to keep the reins past $68.10, a horizontal area comprising multiple levels marked since mid-June, around $69.50, will be the key to follow.
WTI: Daily chart
Trend: Further weakness expected
Information on these pages contains forward-looking statements that involve risks and uncertainties. Markets and instruments profiled on this page are for informational purposes only and should not in any way come across as a recommendation to buy or sell in these assets. You should do your own thorough research before making any investment decisions. FXStreet does not in any way guarantee that this information is free from mistakes, errors, or material misstatements. It also does not guarantee that this information is of a timely nature. Investing in Open Markets involves a great deal of risk, including the loss of all or a portion of your investment, as well as emotional distress. All risks, losses and costs associated with investing, including total loss of principal, are your responsibility. The views and opinions expressed in this article are those of the authors and do not necessarily reflect the official policy or position of FXStreet nor its advertisers. The author will not be held responsible for information that is found at the end of links posted on this page.
If not otherwise explicitly mentioned in the body of the article, at the time of writing, the author has no position in any stock mentioned in this article and no business relationship with any company mentioned. The author has not received compensation for writing this article, other than from FXStreet.
FXStreet and the author do not provide personalized recommendations. The author makes no representations as to the accuracy, completeness, or suitability of this information. FXStreet and the author will not be liable for any errors, omissions or any losses, injuries or damages arising from this information and its display or use. Errors and omissions excepted.
The author and FXStreet are not registered investment advisors and nothing in this article is intended to be investment advice.
Recommended content
Editors’ Picks

US headline CPI came in at 2.4% YoY in March – LIVE
The latest figures from the Bureau of Labor Statistics (BLS) show that the headline Consumer Price Index (CPI) increased by 2.4% YoY last month—coming in below economists’ forecasts. Meanwhile, core CPI, which excludes the more unpredictable food and energy categories, climbed 2.8% over the last twelve months.

EUR/USD maintains its strong gains above 1.1100 post-US CPI
Heavy losses in the US Dollar prompt EUR/USD to flirt with the area of yearly peaks above the 1.1100 region following the release of US inflation readings in March.

Gold is trading on a positive footing near $3,130 after US inflation
Prices of Gold trade with marked gains following March’s US inflation prints, hovering around the $3,130 zone against the backdrop of a strong bearish bias in the Greenback and mixed US yields across the curve.

GBP/USD extends its advance to weekly highs on US CPI data
GBP/USD clinches its third consecutive daily advance, breaking above 1.2900 the figure and hitting fresh four-day highs in the wake of US inflation figures gauged by the CPI, and the weaker Greenback.

Trump’s tariff pause sparks rally – What comes next?
Markets staged a dramatic reversal Wednesday, led by a 12% surge in the Nasdaq and strong gains across major indices, following President Trump’s unexpected decision to pause tariff escalation for non-retaliating trade partners.

The Best brokers to trade EUR/USD
SPONSORED Discover the top brokers for trading EUR/USD in 2025. Our list features brokers with competitive spreads, fast execution, and powerful platforms. Whether you're a beginner or an expert, find the right partner to navigate the dynamic Forex market.