WTI Price Analysis: Battles immediate hurdle above $66 on upbeat China data
- WTI pierces one-week-old resistance line as China prints strong Retail Sales, Industrial Production for January.
- Strong RSI favors run-up to multi-month top marked last week, 100-HMA, fortnight-long support line test short-term sellers.

Following the recent uptick to poke immediate key resistance line on China’s upbeat data, WTI wavers around $66.30, up 1.0% intraday, during early Monday. In doing so, the energy benchmark justifies upbeat RSI conditions as well as the quote’s sustained trading above 100-HMA and an ascending support line from March 02.
Read: China’s Jan data dump: Retail Sales and Industrial Output beat estimates
However, a clear break above $66.35 will be necessary for oil bulls before eyeing the highest levels since late 2018 marked during the last week, around $67.85-90.
Also acting as an upside barrier is the October 29, 2018 peak surrounding $68.00.
Meanwhile, pullback moves may eye $65.50 but a confluence of 100-HMA and an ascending support line near $65.00 will be a tough nut to crack for the WTI sellers.
Should there be a clear downside below $65.00, $63.15 and the monthly low around $59.20-15 will gain the market’s attention.
WTI four-hour chart
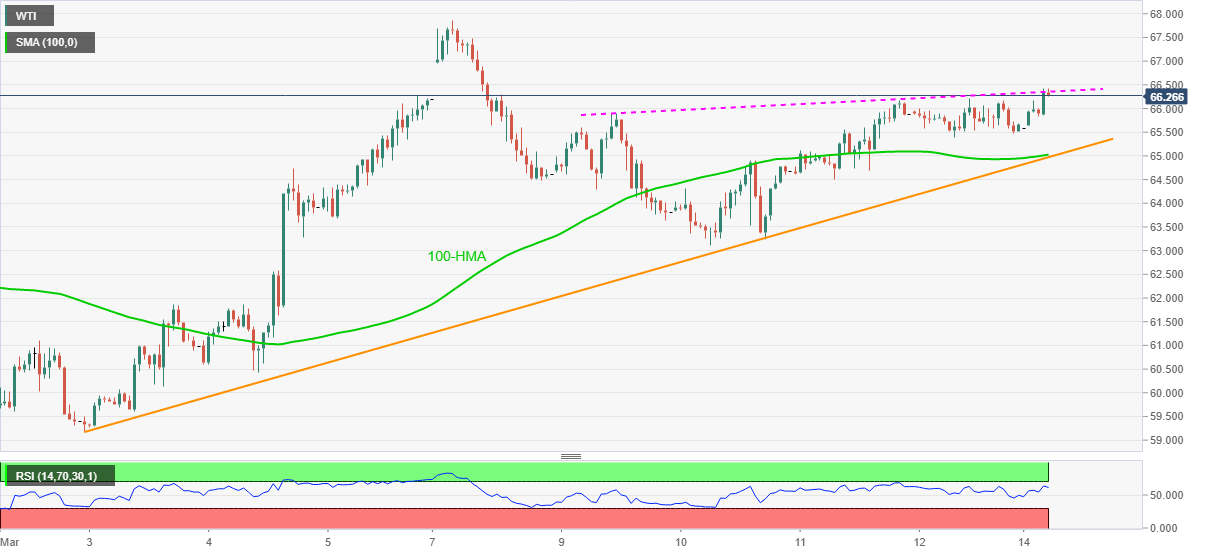
Trend: Bullish
Author

Anil Panchal
FXStreet
Anil Panchal has nearly 15 years of experience in tracking financial markets. With a keen interest in macroeconomics, Anil aptly tracks global news/updates and stays well-informed about the global financial moves and their implications.