|

WTI Price Analysis: 50/100-HMA confluence guards immediate upside

  • WTI prints mild losses while declining below $48.00.
  • Receding MACD histogram, strong upside hurdle challenge bulls.
  • Two-week-old horizontal support restricts short-term declines, buyers can remain hopeful beyond August top.

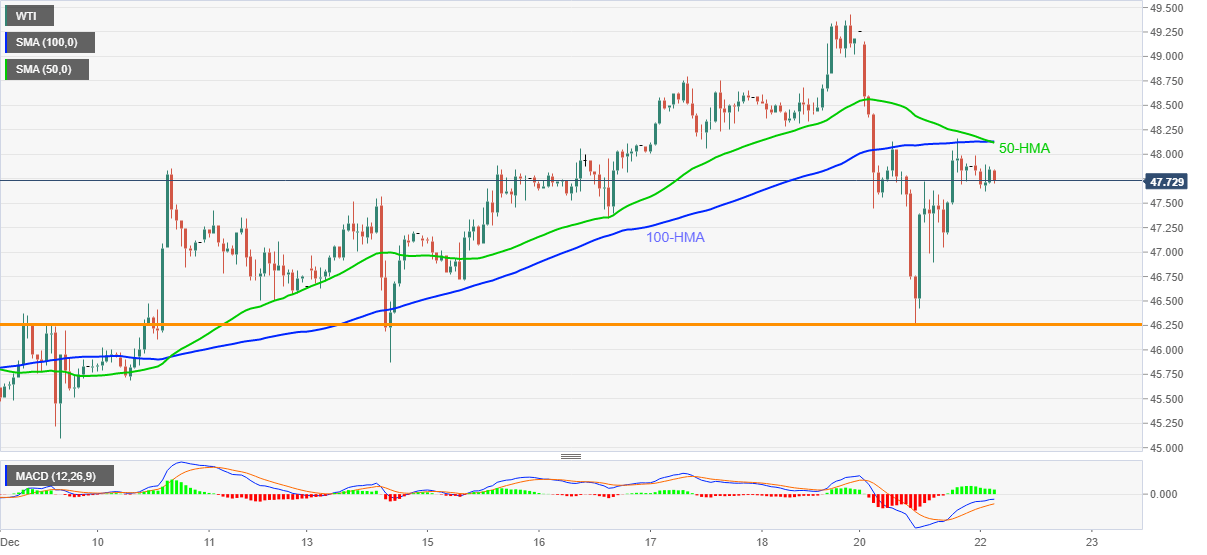
WTI eases to $47.79, down 0.10% intraday, during early Tuesday. The energy benchmark posted the biggest daily losses in six weeks the previous day. Though, a horizontal line comprising multiple levels since December 09 restricted further downside.

It should, however, be noted that the corrective recovery beyond the stated support line fails to cross a confluence of 50 and 100-HMAs. The receding upside momentum also takes clues from the MACD histogram, which in turn suggests the immediate weakness of the black gold.

As a result, the $47.00 threshold can lure the oil sellers ahead of directing them to the aforementioned support near $46.25. Though, any further weakness will not hesitate to challenge the monthly low near $44.00.

However, WTI buyers are likely to remain hopeful unless witnessing a daily closing below August month’s top near $43.85.

On the contrary, a clear break above the SMA convergence near $48.15 will quickly challenge the multi-month peak, marked last Friday, near $49.45.

Overall, the energy prices are in an uptrend that eyes the $50.00 threshold.

WTI hourly chart

Trend: Bullish

Additional important levels

Overview
Today last price47.8
Today Daily Change-0.04
Today Daily Change %-0.08%
Today daily open47.84
 
Trends
Daily SMA2046.4
Daily SMA5042.62
Daily SMA10041.75
Daily SMA20037
 
Levels
Previous Daily High49.26
Previous Daily Low46.27
Previous Weekly High49.43
Previous Weekly Low45.87
Previous Monthly High46.31
Previous Monthly Low33.85
Daily Fibonacci 38.2%47.41
Daily Fibonacci 61.8%48.12
Daily Pivot Point S146.32
Daily Pivot Point S244.8
Daily Pivot Point S343.33
Daily Pivot Point R149.31
Daily Pivot Point R250.78
Daily Pivot Point R352.29

Author

Anil Panchal

Anil Panchal

FXStreet

Anil Panchal has nearly 15 years of experience in tracking financial markets. With a keen interest in macroeconomics, Anil aptly tracks global news/updates and stays well-informed about the global financial moves and their implications.

More from Anil Panchal
Share:

Editor's Picks

EUR/USD holds losses near 1.1850 as US, China holidays keep trade muted

EUR/USD opens the week on a softer note, trading near 1.1860 during the Asian session on Monday. Activity is likely to remain muted, with United States markets closed for the Presidents’ Day holiday, while Mainland China is also shut for the week-long Lunar New Year break.

GBP/USD flat lines as traders await key UK macro data and FOMC minutes

The GBP/USD pair kicks off a new week on a subdued note and oscillates in a narrow range, just below mid-1.3600s, during the Asian session. Moreover, the mixed fundamental backdrop warrants some caution for aggressive traders as the market focus now shifts to this week's important releases from the UK and the US.

Gold remains below $5,050 despite Fed rate cut bets, uncertain geopolitical tensions

Gold edges lower after registering over 2% gains in the previous session, trading around $5,030 per troy ounce during the Asian hours on Monday. However, the non-interest-bearing Gold could further gain ground following softer January Consumer Price Index figures, which reinforced expectations that the Federal Reserve could cut rates later this year.

Top Crypto Losers: Dogecoin, Zcash, Bonk – Meme and Privacy coins under pressure

Meme coins such as Dogecoin and Bonk, alongside the privacy coin Zcash (ZEC), are leading the broader market losses over the last 24 hours. DOGE, ZEC, and BONK ended their three consecutive days of recovery with a sudden decline on Sunday, as crucial resistance levels capped the gains. Technically, the altcoins show downside risk, starting the week under pressure.

Global inflation watch: Signs of cooling services inflation

Realized inflation landed close to expectations in January, as negative base effects weighed on the annual rates. Remaining sticky inflation is largely explained by services, while tariff-driven goods inflation remains limited even in the US.

Ripple Price Forecast: XRP potential bottom could be in sight

Ripple edges up above the intraday low of $1.35 at the time of writing on Friday amid mixed price actions across the crypto market. The remittance token failed to hold support at $1.40 the previous day, reflecting risk-off sentiment amid a decline in retail and institutional sentiment.