- WTI crude oil trades with over 0.50% losses after hitting a high of $90.34.
- Federal Reserve's decision to hold rates but project higher rates for the next year has snapped WTI’s three-week rally.
- Oil prices were cushioned by a drop in oil rigs count in the US, along with China’s economic recovery accelerating.
West Texas Intermediate (WTI), the US crude oil benchmark, traded with more than 0.50% losses on Monday as Russia tweaked its fuel ban. At the same time, higher interest rates in the United States (US) boosted the Greenback (USD), a headwind for US dollar-denominated assets. WTI is trading at $89.35 per barrel, late in the North American session.
West Texas Intermediate dips on Russia’s relaxing fuel ban, strong USD
Investors' mood remains downbeat as speculations the US central bank would increase rates one more time. According to some banks on Wall Street, Russia’s approval of changes to its fuel export ban was a headwind to oil prices, which were set to hit $100 per barrel.
Last week’s Fed decision to hold rates but upward revise the dot-plots for the next year, foreseeing rates above 5%, snapped oil’s three-week rally that witnessed WTI gaining more than 10%, as Saudi Arabia and Russia extended its crude oil output cuts toward December 2023.
The Fed sent US bond yields skyrocketing, underpinning the Greenback to a year-to-date high of 106.09, as drafted by the US Dollar Index (DXY). Nevertheless, WTI’s fall was cushioned by the oil rig's count falling last week to 507 from 515, despite higher oil prices.
In the meantime, speculations of better economic data from China keep oil traders’ spirits higher, following last week’s data. China is the world’s largest oil importer, and if economic activity slows down, it could weigh on global oil prices.
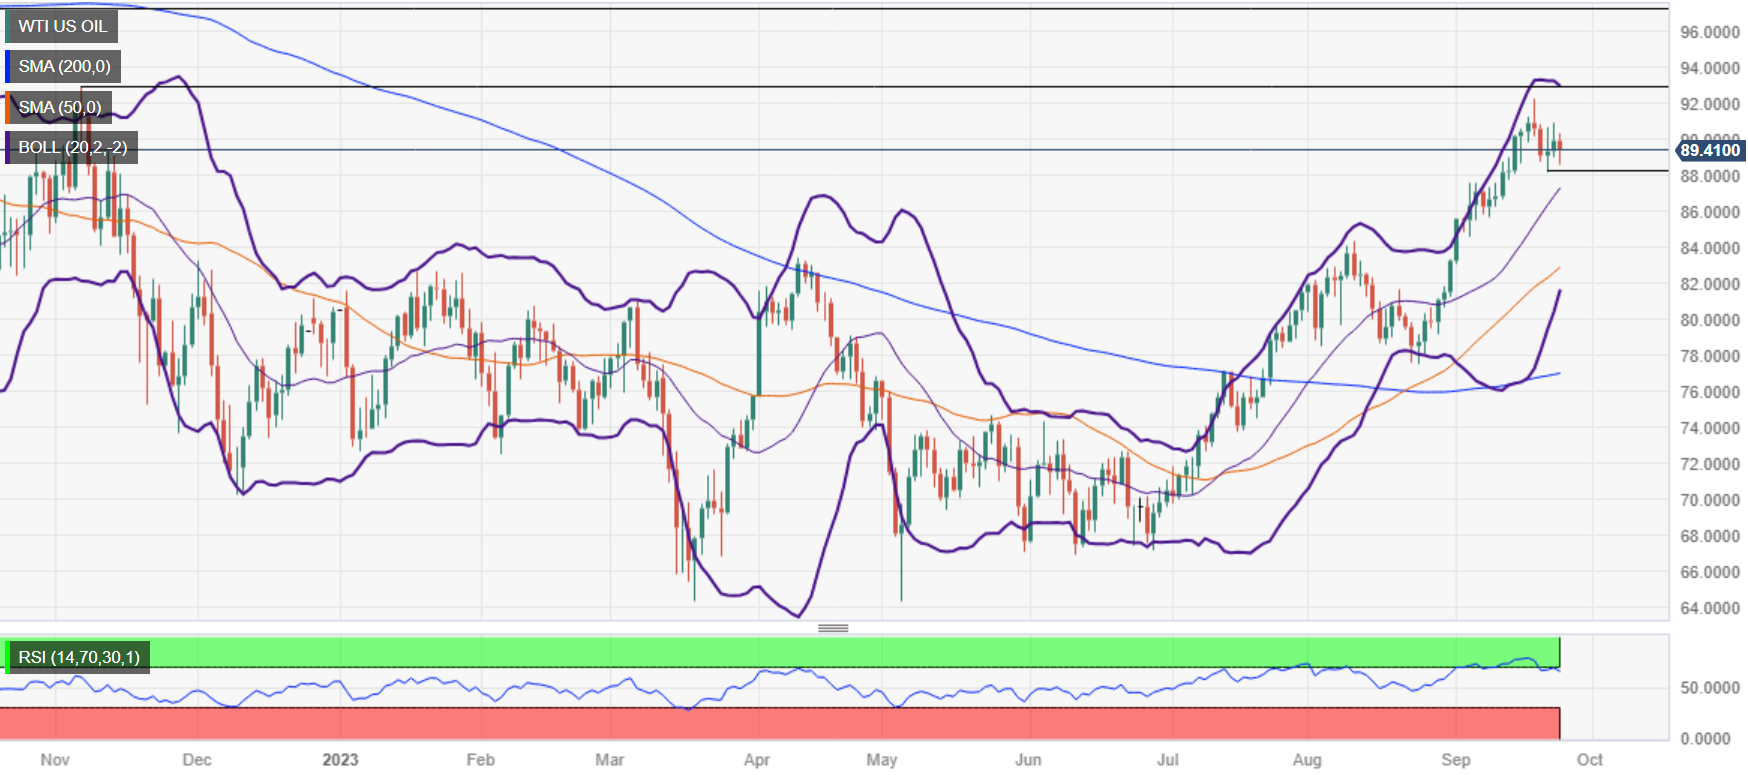
WTI Price Analysis: Technical outlook
WTI remains upward biased but fails to pierce the top-Bollinger band, while the Relative Strength Index (RSI) exits from overbought conditions, opening the door for a pullback. Support is seen at the September 21 daily low of $88.15 before the US crude oil price tests the 20-day Exponential Moving Average (DMA) at $87.31. Contrarily, WTI would resume its uptrend but must clear last Friday's high at $90.93 before challenging the year-to-date (YTD) high at $92.26.
Information on these pages contains forward-looking statements that involve risks and uncertainties. Markets and instruments profiled on this page are for informational purposes only and should not in any way come across as a recommendation to buy or sell in these assets. You should do your own thorough research before making any investment decisions. FXStreet does not in any way guarantee that this information is free from mistakes, errors, or material misstatements. It also does not guarantee that this information is of a timely nature. Investing in Open Markets involves a great deal of risk, including the loss of all or a portion of your investment, as well as emotional distress. All risks, losses and costs associated with investing, including total loss of principal, are your responsibility. The views and opinions expressed in this article are those of the authors and do not necessarily reflect the official policy or position of FXStreet nor its advertisers. The author will not be held responsible for information that is found at the end of links posted on this page.
If not otherwise explicitly mentioned in the body of the article, at the time of writing, the author has no position in any stock mentioned in this article and no business relationship with any company mentioned. The author has not received compensation for writing this article, other than from FXStreet.
FXStreet and the author do not provide personalized recommendations. The author makes no representations as to the accuracy, completeness, or suitability of this information. FXStreet and the author will not be liable for any errors, omissions or any losses, injuries or damages arising from this information and its display or use. Errors and omissions excepted.
The author and FXStreet are not registered investment advisors and nothing in this article is intended to be investment advice.


Recommended content
Editors’ Picks

EUR/USD bounces off lows, retests 1.1370
Following an early drop to the vicinity of 1.1310, EUR/USD now manages to regain pace and retargets the 1.1370-1.1380 band on the back of a tepid knee-jerk in the US Dollar, always amid growing optimism over a potential de-escalation in the US-China trade war.

GBP/USD trades slightly on the defensive in the low-1.3300s
GBP/USD remains under a mild selling pressure just above 1.3300 on Friday, despite firmer-than-expected UK Retail Sales. The pair is weighed down by a renewed buying interest in the Greenback, bolstered by fresh headlines suggesting a softening in the rhetoric surrounding the US-China trade conflict.

Gold remains offered below $3,300
Gold reversed Thursday’s rebound and slipped toward the $3,260 area per troy ounce at the end of the week in response to further improvement in the market sentiment, which was in turn underpinned by hopes of positive developments around the US-China trade crisis.

Ethereum: Accumulation addresses grab 1.11 million ETH as bullish momentum rises
Ethereum saw a 1% decline on Friday as sellers dominated exchange activity in the past 24 hours. Despite the recent selling, increased inflows into accumulation addresses and declining net taker volume show a gradual return of bullish momentum.

Week ahead: US GDP, inflation and jobs in focus amid tariff mess – BoJ meets
Barrage of US data to shed light on US economy as tariff war heats up. GDP, PCE inflation and nonfarm payrolls reports to headline the week. Bank of Japan to hold rates but may downgrade growth outlook. Eurozone and Australian CPI also on the agenda, Canadians go to the polls.

The Best brokers to trade EUR/USD
SPONSORED Discover the top brokers for trading EUR/USD in 2025. Our list features brokers with competitive spreads, fast execution, and powerful platforms. Whether you're a beginner or an expert, find the right partner to navigate the dynamic Forex market.