- China’s coronavirus crisis weighs on WTI price, on speculations of lower demand.
- The Eurozone threatening to impose a cap on Rusian and a buoyant US Dollar keeps WTI defensive.
- WTI Price Analysis: A daily close below $80.00 could pave the way for a YTD low re-test.
Western Texas Intermediate (WTI), the US crude oil benchmark, remains moderately negative due to low demand concerns surrounding the crude oil market. Factors like ongoing China’s Covid-19 outbreak and reports emerging during the week for increased crude output keep the WTI price stable. At the time of writing, WTI exchanges hands around $77.46 PB
Investors’ sentiment is mixed, in part spurred by thin liquidity conditions amid a shortened week due to the US Thanksgiving holiday. Additionally, China’s registering high number of Covid-19 cases would dent demand for the black gold, weighed on WTI price.
Newswires reported that cases peaked around 31,987 on Thursday, up from Wednesday’s 29,754. At the beginning of the week, Chinese authorities revealed measures to relax Covid-19, aiming to be less restrictive. Still, officials in some cities are again reimposing stricter measures and ordering lockdowns as they scramble to suppress the virus.
Aside from this, reports that the European Union continues its discussions to impose a price cap to Russian oil, between $65 to $70 per barrel, depressed oil prices.
Additionally, the US Dollar (USD) appreciated Friday as some short covering speculation surrounded the market. The US Dollar Index (DXY), a gauge of the greenback’s value against a basket of six peers, climbs 0.36%, up at 106.000.
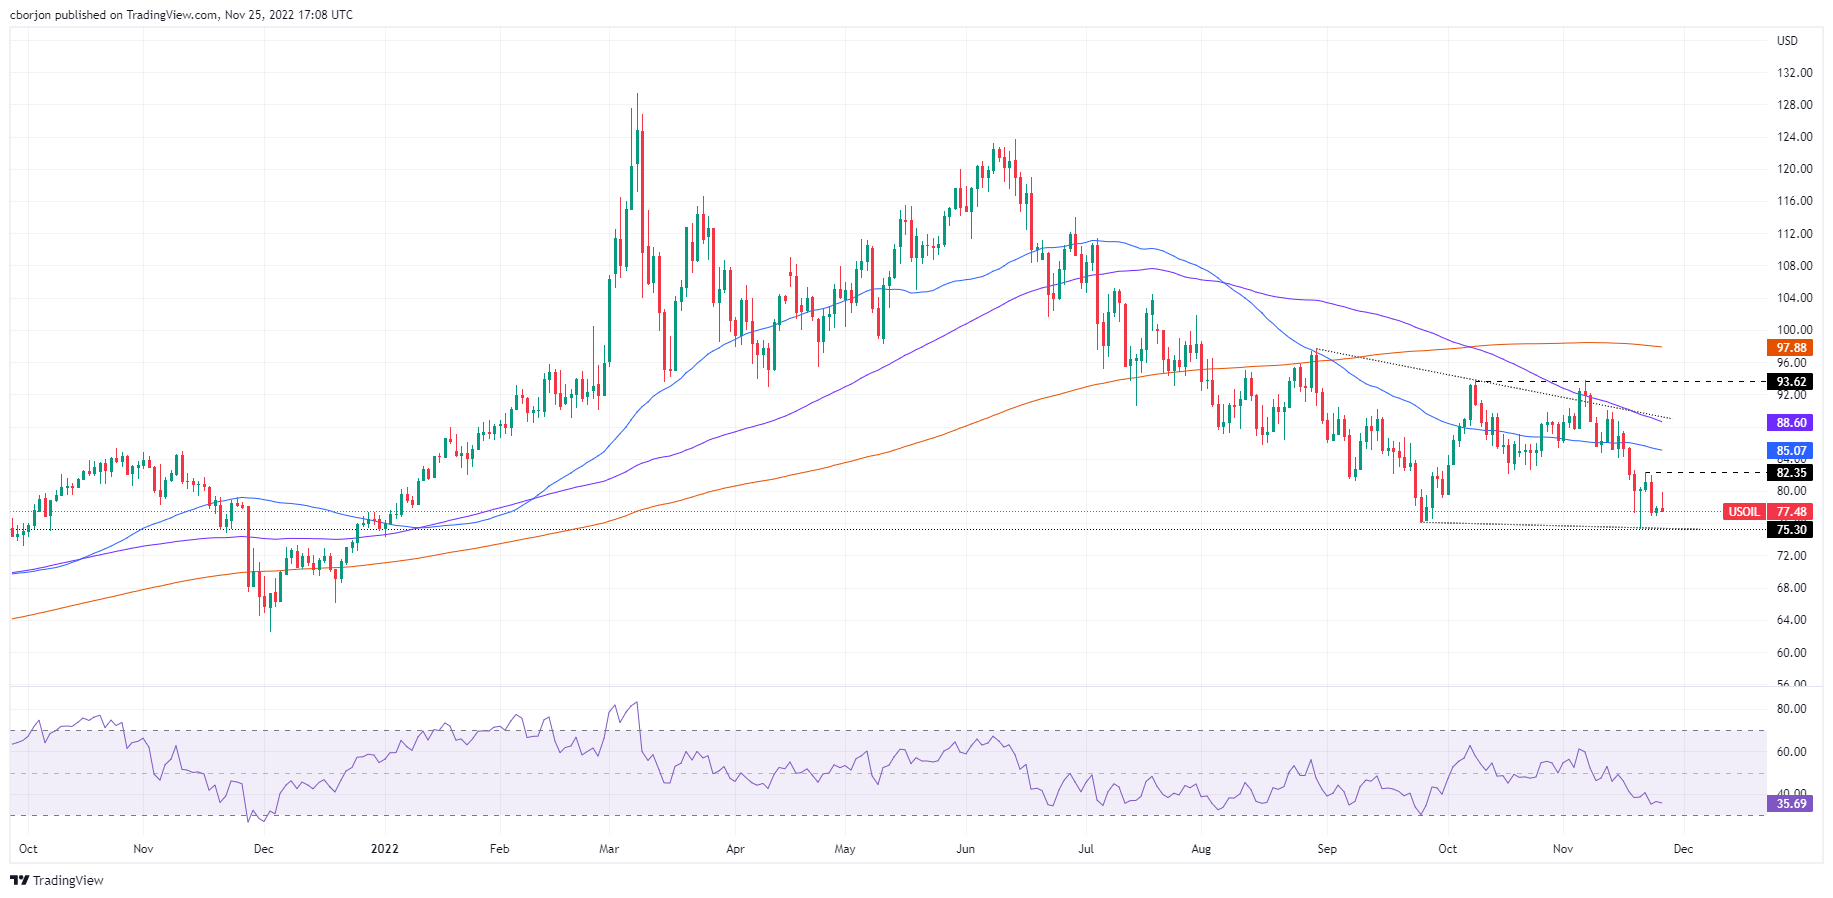
WTI Price Analysis: Technical outlook
After reaching a weekly high of $82.35 PB on Tuesday, WTI prolonged its losses throughout the week. Of note, WTI falling below $80.00 PB opened the door for further downside and might test the November 21 low of $75.30 if some fundamental reasons increased uncertainty about oil demand. Notably, the Relative Strength Index (RSI) continues to fall further, meaning that sellers are gathering momentum.
Therefore, WTI’s path of least resistance is downwards. WTI’s first support would be $77.00. Break below will expose the November 21 low of $75.30, which, once cleared, could send the WTI price tumbling toward its YTD low of $74.30.
Information on these pages contains forward-looking statements that involve risks and uncertainties. Markets and instruments profiled on this page are for informational purposes only and should not in any way come across as a recommendation to buy or sell in these assets. You should do your own thorough research before making any investment decisions. FXStreet does not in any way guarantee that this information is free from mistakes, errors, or material misstatements. It also does not guarantee that this information is of a timely nature. Investing in Open Markets involves a great deal of risk, including the loss of all or a portion of your investment, as well as emotional distress. All risks, losses and costs associated with investing, including total loss of principal, are your responsibility. The views and opinions expressed in this article are those of the authors and do not necessarily reflect the official policy or position of FXStreet nor its advertisers. The author will not be held responsible for information that is found at the end of links posted on this page.
If not otherwise explicitly mentioned in the body of the article, at the time of writing, the author has no position in any stock mentioned in this article and no business relationship with any company mentioned. The author has not received compensation for writing this article, other than from FXStreet.
FXStreet and the author do not provide personalized recommendations. The author makes no representations as to the accuracy, completeness, or suitability of this information. FXStreet and the author will not be liable for any errors, omissions or any losses, injuries or damages arising from this information and its display or use. Errors and omissions excepted.
The author and FXStreet are not registered investment advisors and nothing in this article is intended to be investment advice.
Recommended content
Editors’ Picks
EUR/USD recovers toward 1.0500 after mixed US PMI data
EUR/USD rebounds toward 1.0500 in the American session on Friday after the data from the US showed that the business activity in the private sector expanded at a softer pace than anticipated in early February. The pair remains on track to end the week with little changed.
GBP/USD rises above 1.2650, looks to post weekly gains
GBP/USD regains its traction and trades above 1.2650 in the second half of the day on Friday. The data from the US showed that the S&P Global Services PMI dropped into the contraction territory below 50 in February, causing the US Dollar to lose strength and helping the pair edge higher.
Gold holds above $2,930 as US yields edge lower
Gold holds above $2,930 after correcting from the record-high it set above $2,950 on Thursday. Following the mixed PMI data from the US, the benchmark 10-year US Treasury bond yield stays in negative territory below 4.5% and allows XAU/USD to hold its ground.
Crypto exchange Bybit hacked for $1.4 billion worth of ETH
Following a security breach first spotted by crypto investigator ZachXBT, crypto exchange Bybit announced that it suffered a hack where an attacker compromised one of its ETH wallets.
Money market outlook 2025: Trends and dynamics in the Eurozone, US, and UK
We delve into the world of money market funds. Distinct dynamics are at play in the US, eurozone, and UK. In the US, repo rates are more attractive, and bills are expected to appreciate. It's also worth noting that the Fed might cut rates more than anticipated, similar to the UK. In the eurozone, unsecured rates remain elevated.
The Best brokers to trade EUR/USD
SPONSORED Discover the top brokers for trading EUR/USD in 2025. Our list features brokers with competitive spreads, fast execution, and powerful platforms. Whether you're a beginner or an expert, find the right partner to navigate the dynamic Forex market.