WTI extends four-day downtrend towards $74.20 support as risk-aversion weighs on commodities
- WTI crude oil drops to the lowest levels since February 27, down for the fourth consecutive day.
- Fears of higher inflation, rate lifts join pre-data anxiety to weigh on Oil price.
- Sluggish US Dollar, Treasury bond yields fail to recall energy buyers.
- US NFP, Russia’s reaction to US ties with UK, Australia for nuclear submarine eyed.

WTI crude oil prices remain on the back foot around $75.20 as bears cheer the four-day losing streak amid early Friday in Europe. In doing so, the energy benchmark bears the burden of the risk-off mood ahead of the key data/events.
That said, fears of higher inflation and the need for more rate lifts from the major central banks seem to roil the risk profile.
New York Fed mentioned, in its latest report, that recent upward revisions to inflation data coupled with higher-than-expected levels of inflation had changed the picture of what had appeared to be cooling in price pressures. It should be observed that the previous day’s mixed signals of the US employment data allowed the US Dollar to remain weak, which in turn seemed to have put a floor under the Oil price.
On the contrary, Bloomberg’s analysis suggesting China’s consumer spending is showing signs of a strong rebound joins the hopes of more stimulus from the dragon nation and the US readiness for more spending to prod the risk-off mood and the Oil bears. Additionally putting a floor under the WTI are the geopolitical fears surrounding US President Joe Biden’s budget proposal for 2024 and the US partnership with the UK and Australia for nuclear submarines.
While portraying the mood, S&P 500 Futures remain depressed at the monthly low while US Treasury bond yields stretch the previous day’s pullback from a multi-day high.
Moving on, Oil traders should pay attention to the risk catalysts, as well as the US employment report for February for clear directions.
Technical analysis
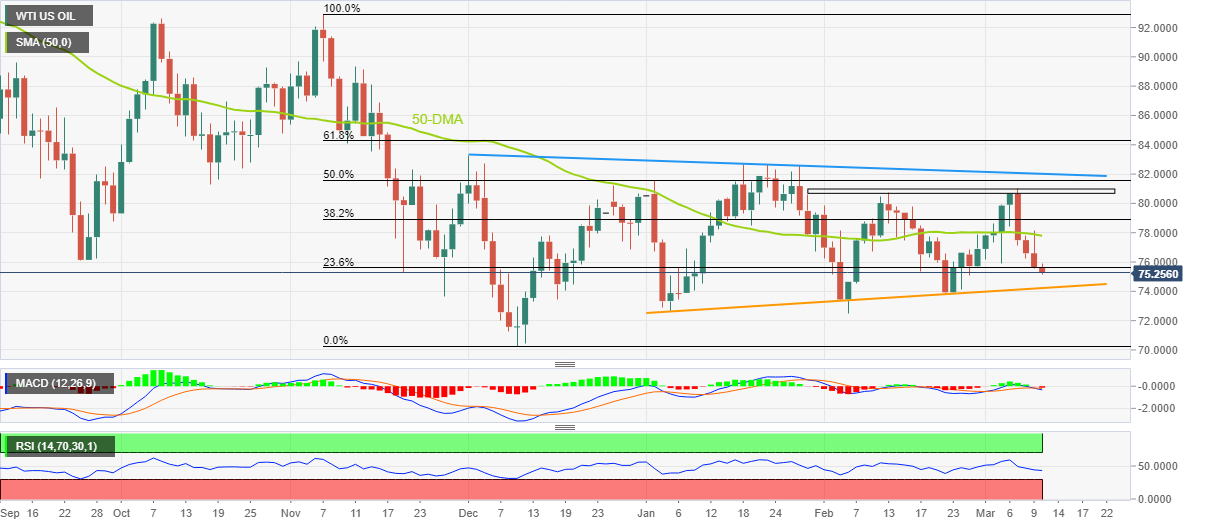
WTI slips below the 23.6% Fibonacci retracement level of its November-December 2022 downside, near $75.60, to stretch the early-week pullback from the six-week-old horizontal resistance area surrounding $80.80-$81.00.
The black gold’s pullback joins bearish MACD signals and downbeat RSI (14), not oversold, to keep sellers hopeful of marking another try in breaking the two-month-old ascending support line near $74.20.
Following that, $72.60 is likely a small buffer during the anticipated fall towards January’s low near $70.30.
Alternatively, the 50-DMA level surrounding $77.80 guards the WTI’s immediate recovery ahead of the aforementioned multi-day-old horizontal resistance area near $81.00.
It’s worth noting, however, that the 50% Fibonacci retracement level and a descending resistance line from early December 2022, close to $81.60 and $82.00 in that order, also challenge the WTI crude oil buyers.
WTI crude oil: Daily chart
Trend: Further downside expected
Author

Anil Panchal
FXStreet
Anil Panchal has nearly 15 years of experience in tracking financial markets. With a keen interest in macroeconomics, Anil aptly tracks global news/updates and stays well-informed about the global financial moves and their implications.


