|

WTI crude slumps nearly 5% on global economic concerns, forecast downgrades

  • WTI nosedives to $66.80, influenced by global economic deceleration and reduced oil price forecasts.
  • Goldman Sachs revises WTI year-end forecast to $81 per barrel amid potential increased supplies.
  • Upcoming US CPI data and Fed’s decisions are closely watched; the Saudi production cut provides a slight cushion.

Western Texas Intermediate (WTI), the US crude oil benchmark, plunges sharply due to see an ongoing global economic deceleration, as well as analysts slashing oil price forecasts ahead of the release of inflation in the United States (US), and the Federal Reserve (Fed) meeting on Wednesday. WTI is trading at $66.80, plummeting almost 5% after hitting a daily high of $70.22.

Anticipated US inflation data and Fed’s meeting influence the oil market, as Goldman Sachs trims year-end WTI estimate

Wall Street is trading with solid gains at the start of the week. Expectations for an increase of supplies from Russia and Iran triggered a forecast revision from Goldman Sachs, which downward revised WTI from $89 a barrel to $81 by the year’s end.

Weaker than expected, last week’s data from China, showing that exports contracted above estimates showed a grim outlook for global demand amongst developed markets. Alongside speculations that the People’s Bank of China (PboC) will reduce rates to stimulate the economy triggered Monday’s drop despite OPEC+’s efforts to cushion oil prices.

In the meantime, the US will reveal the Consumer Price Index (CPI) for May, which is expected to show the impact of 500 basis points (bps) of rate hikes by the Fed. Upward surprises on the data would likely trigger a reaction by the Fed, as Jerome Powell and Co would reveal its decision on Wednesday at around 18:00 GMT.

Further Fed increases would boost the US Dollar (USD), a headwind for dollar-denominated assets. However, WTI’s fall was capped by the Saudis, which pledged to cut oil production in July.

WTI Price Analysis: Technical outlook

WTI Daily chart

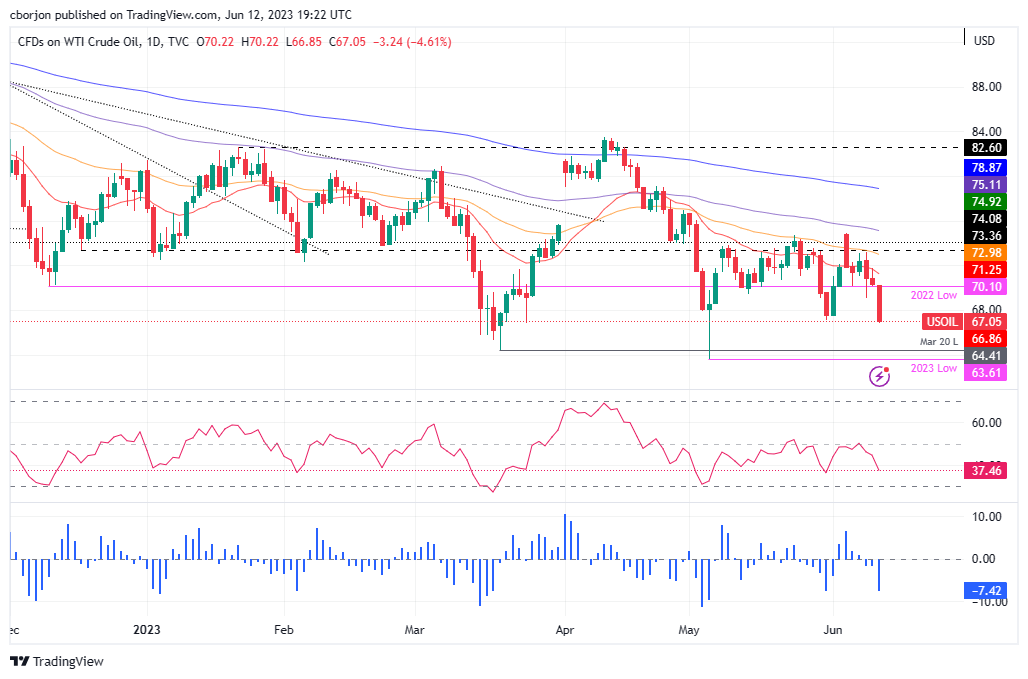
The US crude oil benchmark fell below May’s low of $67.08, opening the door for further losses, beneath the $67.00 mark, putting into play March’s 20 swing low at $64.41, ahead of challenging the year-to-date (YTD) low of $63.61. On the upside, WTI’s first resistance would be the 2022 low of $70.10, followed by the 20-day Exponential Moving Average (EMA) at $71.23. A breach of the latter will expose the 50-day EMA at $72.97.

The Relative Strength Index (RSI) and the three-day Rate of Change (RoC) portray sellers gathering momentum, so more downside is expected.

WTI US OIL

Overview
Today last price67.2
Today Daily Change-3.26
Today Daily Change %-4.63
Today daily open70.46
 
Trends
Daily SMA2071.66
Daily SMA5074.67
Daily SMA10075.28
Daily SMA20078.58
 
Levels
Previous Daily High71.9
Previous Daily Low70.24
Previous Weekly High74.36
Previous Weekly Low69.17
Previous Monthly High76.61
Previous Monthly Low64.31
Daily Fibonacci 38.2%70.88
Daily Fibonacci 61.8%71.27
Daily Pivot Point S169.83
Daily Pivot Point S269.2
Daily Pivot Point S368.17
Daily Pivot Point R171.5
Daily Pivot Point R272.53
Daily Pivot Point R373.16

Author

Christian Borjon Valencia

Markets analyst, news editor, and trading instructor with over 14 years of experience across FX, commodities, US equity indices, and global macro markets.

More from Christian Borjon Valencia
Share:

Editor's Picks

EUR/USD: US Dollar comeback in the makes?

The US Dollar stands victorious at the end of another week, with the EUR/USD pair trading near a four-week low of 1.1742, while the USD retains its strength despite some discouraging American data released at the end of the week. The pair edged higher on Friday, after the United States Supreme Court ruled against President Donald Trump's tariffs, although the advance is not enough to change the latest USD flow.

GBP/USD braces for more pain, as 200-day SMA tested

GBP/USD broke the previous week’s consolidation to the downside, as sellers returned with pomp, smashing the major back toward the levels last seen in late January. The pair tested bids below the 1.3450 barrier as the US Dollar strength largely played out throughout the week, while the Pound Sterling stepped back on expectations of divergent monetary policy outlooks between the Bank of England and the US Federal Reserve.

Gold climbs to weekly tops, approaches $5,100/oz

Gold keeps the bid tone well in place at the end of the week, now hitting fresh weekly highs and retargeting the key $5,100 mark per troy ounce. The move higher in the yellow metal comes in response to ongoing geopolitical tensions in the Middle East and modest losses in the US Dollar.

Week ahead: Markets brace for heightened volatility as event risk dominates

Dollar strength dominates markets as risk appetite remains subdued. A Supreme Court ruling, geopolitics and Fed developments are in focus. Pivotal Nvidia earnings on Wednesday as investors question tech sector weakness. Yen and aussie diverge; both pound and euro could recoup their losses.

Broadening drivers of growth: Unpacking GDP and looking ahead

This week’s data delivered a familiar theme with an important twist. The U.S. economy continues to be shaped by powerful forces in high-tech and AI-related investment, but recent releases suggest the growth story may finally be broadening. At the same time, trade flows are moving in a less supportive direction, reminding us that not all parts of the economy are pulling in sync.

Ripple bulls defend key support amid waning retail demand and ETF inflows

XRP ticks up above $1.40 support, but waning retail demand suggests caution. XRP attracts $4 million in spot ETF inflows on Thursday, signaling renewed institutional investor interest.