- WTI sees a topside jump to kick off the trading week.
- Middle East stability concerns are threatening oil prices, sending barrels higher.
- Israel ordered Chevron to freeze production at Tamar natural gas field, adding upside pressure to fossils.
West Texas Intermediary (WTI) Crude Oil caught a Monday bid on rising geopolitical tensions following a Hamas rocket attack on Israel in the Gaza Strip over the weekend. At least 700 people are dead and Israel has deployed approximately 100,000 additional troops to the region.
Crude oil markets are seeing rising concerns that an escalation of the Gaza conflict could destabilize Crude Oil supply, sending barrel costs higher for the new trading week and halting an extended decline that has seen oil prices close in the red five of the last six consecutive trading days and shedding nearly 15% peak-to-trough.
Gaza Strip escalation increases supply concerns
The Israeli government ordered US oil giant Chevron to temporarily halt production at its Tamar natural gas field just off the Israeli northern coast. The Tamar facility has frequently been closed down during periods of heightened unrest in the past.
Oil prices are pinning higher on concerns that the Gaza Strip escalation could spill over into additional geopolitical tensions in the Middle East and draw in nearby Iran and Saudi Arabia.
Analysts still expect crude oil supplies to undershoot demand for the last quarter of the year, which will see Crude Oil prices bolstered even further looking forward.
WTI technical outlook
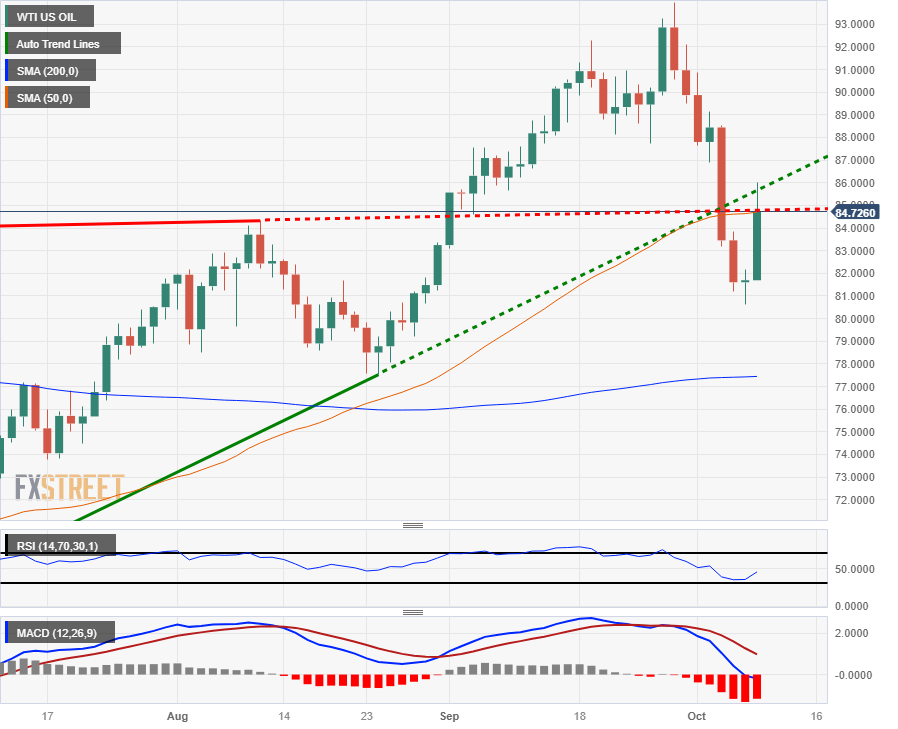
WTI Crude Oil soared nearly 5.5% from the week's opening bids, just barely tipping over the $86.00 level before settling back into softer territory just south of $85.00, and is currently trading near $84.70.
Crude Oil reached a low of 80.63 in early trading before markets kicked off their supply-constraint rally, bringing the decline from September's tail-end peak of $93.98 over 14%.
Technical traders will note that WTI bids are currently getting hung up on the 50-day Simple Moving Average (SMA), and last week's decline through the rising trendline from June's bottom of $67.14 will see Crude Oil prices face additional downside pressure if bullish momentum can't be spooled up high enough.
WTI daily chart

WTI technical levels
Information on these pages contains forward-looking statements that involve risks and uncertainties. Markets and instruments profiled on this page are for informational purposes only and should not in any way come across as a recommendation to buy or sell in these assets. You should do your own thorough research before making any investment decisions. FXStreet does not in any way guarantee that this information is free from mistakes, errors, or material misstatements. It also does not guarantee that this information is of a timely nature. Investing in Open Markets involves a great deal of risk, including the loss of all or a portion of your investment, as well as emotional distress. All risks, losses and costs associated with investing, including total loss of principal, are your responsibility. The views and opinions expressed in this article are those of the authors and do not necessarily reflect the official policy or position of FXStreet nor its advertisers. The author will not be held responsible for information that is found at the end of links posted on this page.
If not otherwise explicitly mentioned in the body of the article, at the time of writing, the author has no position in any stock mentioned in this article and no business relationship with any company mentioned. The author has not received compensation for writing this article, other than from FXStreet.
FXStreet and the author do not provide personalized recommendations. The author makes no representations as to the accuracy, completeness, or suitability of this information. FXStreet and the author will not be liable for any errors, omissions or any losses, injuries or damages arising from this information and its display or use. Errors and omissions excepted.
The author and FXStreet are not registered investment advisors and nothing in this article is intended to be investment advice.
Recommended content
Editors’ Picks

EUR/USD drops below 1.0450 as USD gathers strength
EUR/USD stays on the back foot and trades below 1.0450 on Wednesday. The cautious market stance helps the US Dollar (USD) stay resilient against its rivals and weighs on the pair as markets wait for the Federal Reserve to publish the minutes of the January policy meeting.

Gold climbs to new all-time high near $2,950
Gold retreats slightly from the all-time high it touched at $2,947 but manages to stay above $2,930 on Wednesday. The benchmark 10-year US Treasury bond yield clings to modest gains above 4.55%, limiting XAU/USD's upside.

GBP/USD retreats below 1.2600 despite strong UK inflation data
GBP/USD struggles to hold its ground and trades in the red below 1.2600 on Wednesday. Earlier in the day, the data from the UK showed that the annual CPI inflation climbed to 3% in January from 2.5% in December. Market focus shifts to FOMC Minutes.

Maker Price Forecast: MKR generates highest daily revenue of $10 million
Maker (MKR) price extends its gains by 6%, trading around $1,189 on Wednesday after rallying more than 20% so far this week. Artemis data shows that MKR generated $10 million in revenue on February 10, the new yearly high in daily revenue.

Money market outlook 2025: Trends and dynamics in the Eurozone, US, and UK
We delve into the world of money market funds. Distinct dynamics are at play in the US, eurozone, and UK. In the US, repo rates are more attractive, and bills are expected to appreciate. It's also worth noting that the Fed might cut rates more than anticipated, similar to the UK. In the eurozone, unsecured rates remain elevated.

The Best Brokers of the Year
SPONSORED Explore top-quality choices worldwide and locally. Compare key features like spreads, leverage, and platforms. Find the right broker for your needs, whether trading CFDs, Forex pairs like EUR/USD, or commodities like Gold.