WTI climbs above $77.00 and forms a bullish engulfing candle as bulls eye the 20-DMA around $78.40
- WTI is set to finish the week with more than 2% losses.
- Factors like solid US jobs data and the EU’s embargo on Russian oil-related products underpin WTI.
- WTI Technical Analysis: Near-term shifted upward biased, and it might test $80.00.

The US crude oil benchmark, known as Western Texas Intermediate (WTI)., jumped after the release of a solid job report in the United States (US), though prices are still headed for a weekly loss. At the time of writing, WTI exchanges hand at $77.85 per barrel, at the time of writing.
WTI’s extended its gains on Friday due to a surprising report from the US Department of Labor (DoL) which showed that in January, the economy created 517,000 jobs, surpassing the expected 200,000. As a result, the Unemployment Rate decreased from 3.5% to 3.4%, and the previous month’s figures were revised upwards.
In the meantime, the European oil embargo on Russian refined products that would begin on February 5 is being eyed by oil traders. Russian authorities commented that the EU’s ban could lead to a further imbalance in the global energy markets.
Meanwhile, according to ANZ analysts, China’s reopening has witnessed a sharp increase in traffic in its largest 15 cities following the lunar new year holiday.
All that said, WTI might continue to trim some of its weekly losses as investors are eyeing the 20-day Exponential Moving Average (EMA) at $78.47. Once broken, that could open the door for further upside.
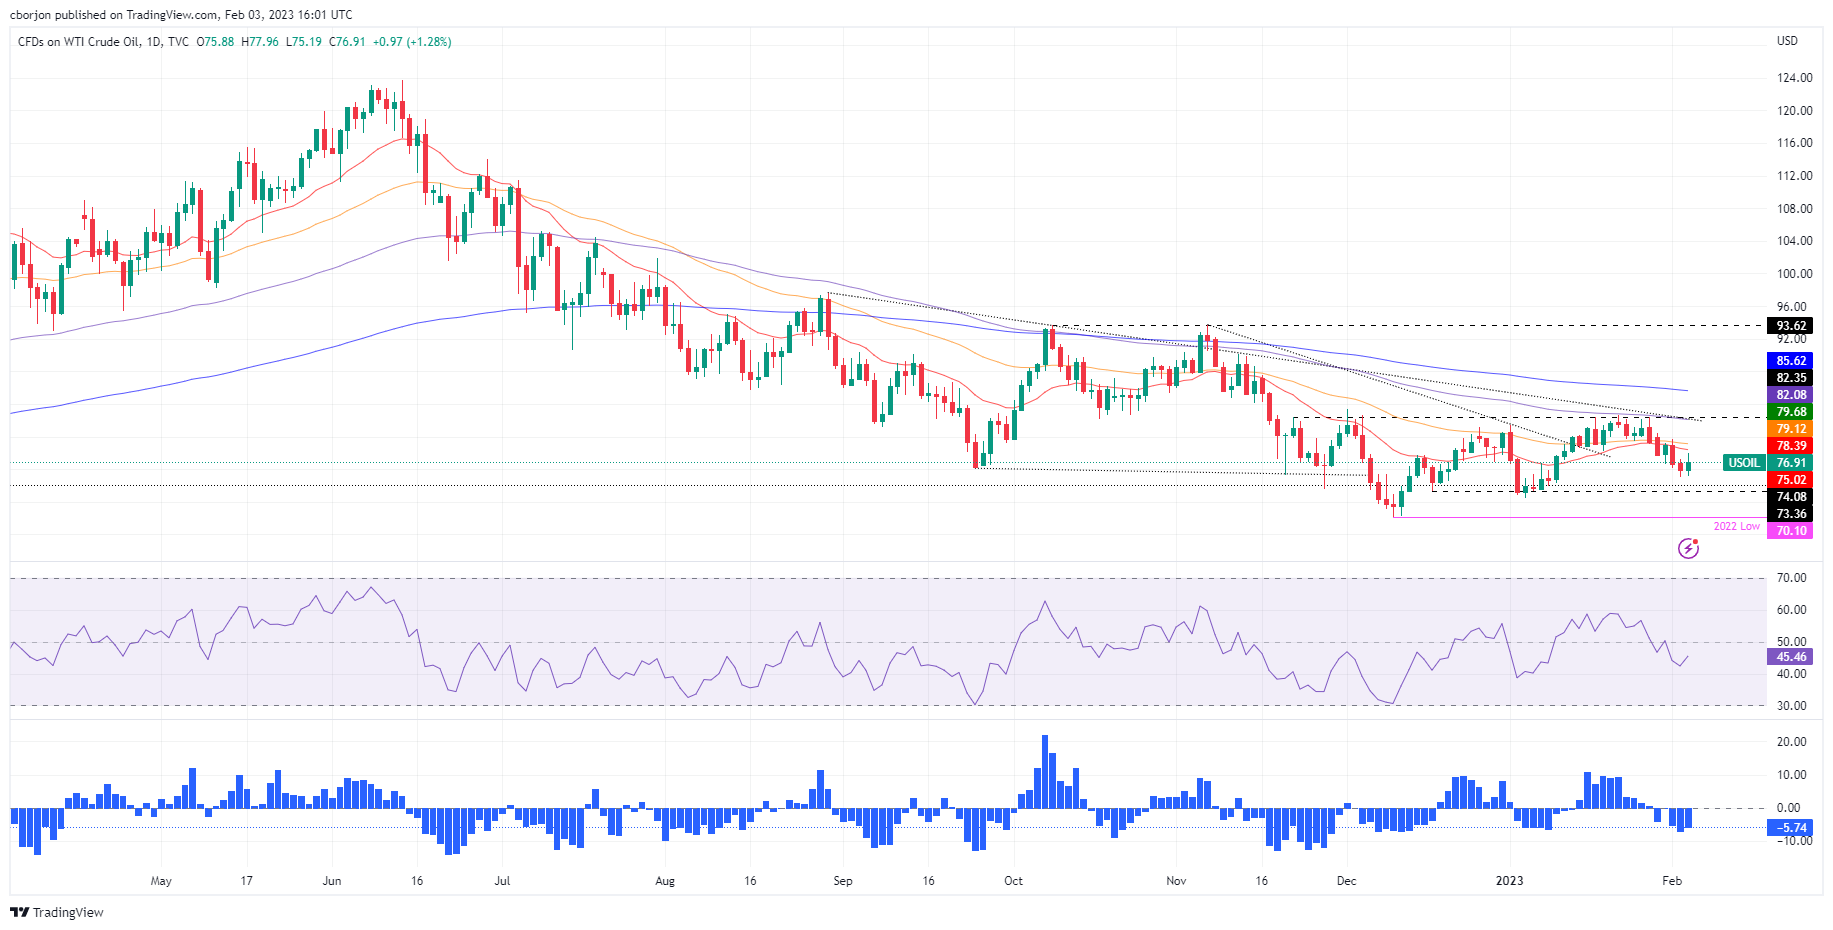
WTI Technical Analysis
WTI’s daily chart portrays oil forming a bullish engulfing candle pattern after bouncing from three-week lows. Although the two-candle pattern is bullish, WTI still needs to hurdle essential resistance levels on the upside. WTI’s first resistance would be the 20-day EMA at $78.42, followed by the 50-day EMA at $79.19, which, once cleated, could pave the way toward the $80.00 per barrel figure.
Author

Christian Borjon Valencia
FXStreet
Markets analyst, news editor, and trading instructor with over 14 years of experience across FX, commodities, US equity indices, and global macro markets.


