ASX: WISETECH GLOBAL LIMITED (WTC) Elliott Wave Technical Analysis.
Greetings!
Our Elliott Wave analysis today focuses on WISETECH GLOBAL LIMITED (ASX: WTC). We observe upside potential in ASX: WTC shares after identifying a recently completed Triangle corrective wave pattern at Wave 4, suggesting a potential Wave 5 move higher.
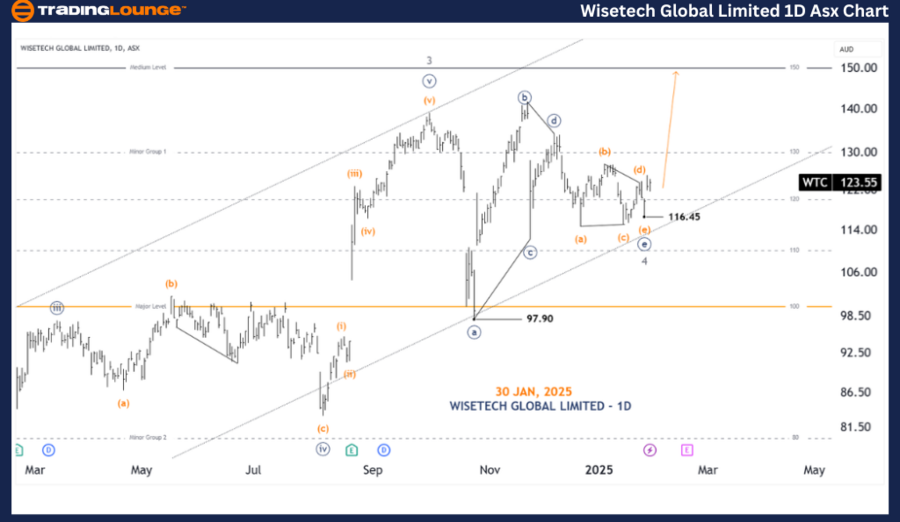
WTC 1D chart (Semilog scale) analysis
-
Function: Major Trend (Minor Degree, Grey).
-
Mode: Motive.
-
Structure: Impulse.
-
Position: Wave 5 (Grey) of Wave (3) (Orange) of Wave ((1)) (Navy).
-
Details:
-
Wave 4 (Grey) appears to have completed a Triangle Pattern at 116.45 low.
-
Wave 5 (Grey) is likely beginning a move higher.
-
-
Invalidation point: 97.90.
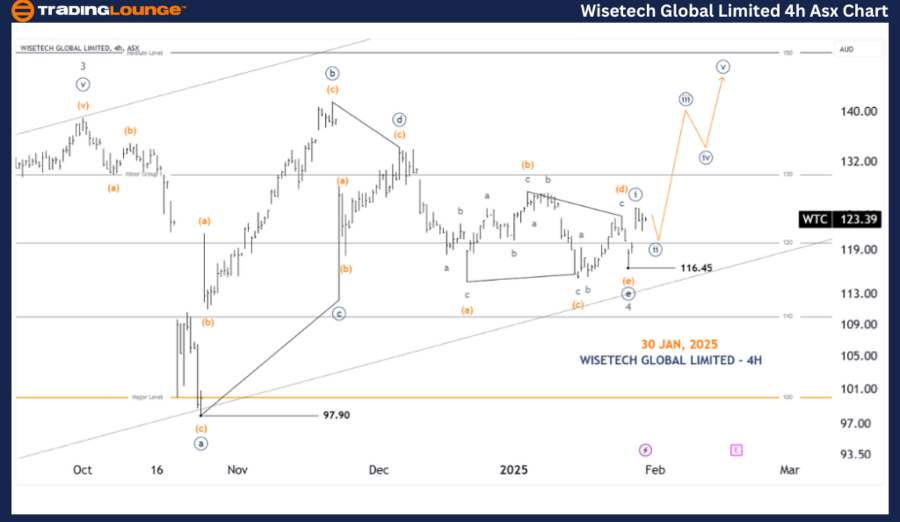
WTC four-hour chart analysis
-
Function: Major Trend (Minute Degree, Navy).
-
Mode: Motive.
-
Structure: Impulse.
-
Position: Wave ((ii)) (Navy) of Wave 5 (Grey).
-
Details:
-
A Triangle inside a Triangle has developed, nearing completion.
-
The overall pattern consists of "9 waves", narrowing over time—a key indicator of this forecast.
-
Wave 5 (Grey) is expected to push higher, targeting a high around AUD 150.00.
-
-
Invalidation point: 116.45.
Conclusion
Our analysis and forecast for WISETECH GLOBAL LIMITED (ASX: WTC) provide traders with insights into market trends and effective trading strategies. The specific price levels given act as validation or invalidation signals for our Elliott Wave count, increasing confidence in this forecast.
By combining technical analysis and contextual trend evaluation, we aim to offer an objective and professional market perspective.
Technical analyst: Hua (Shane) Cuong.
WTC one day chart (semilog scale) analysis [Video]
As with any investment opportunity there is a risk of making losses on investments that Trading Lounge expresses opinions on.
Historical results are no guarantee of future returns. Some investments are inherently riskier than others. At worst, you could lose your entire investment. TradingLounge™ uses a range of technical analysis tools, software and basic fundamental analysis as well as economic forecasts aimed at minimizing the potential for loss.
The advice we provide through our TradingLounge™ websites and our TradingLounge™ Membership has been prepared without considering your objectives, financial situation or needs. Reliance on such advice, information or data is at your own risk. The decision to trade and the method of trading is for you alone to decide. This information is of a general nature only, so you should, before acting upon any of the information or advice provided by us, consider the appropriateness of the advice considering your own objectives, financial situation or needs. Therefore, you should consult your financial advisor or accountant to determine whether trading in securities and derivatives products is appropriate for you considering your financial circumstances.
Recommended content
Editors’ Picks
EUR/USD gathers traction toward 1.0450 amid US Dollar weakness
EUR/USD regains upside traction and nears 1.0450 in the European trading hours on Thursday. Broad US Dollar weakness supports the pair. However, tariff threats from US President Donald Trump and geopolitical tension might cap its upside. US data and Fedspeak remains in focus.
Gold rallies with yields taking a step back
Gold is printing another fresh all-time high at around $2,955. US President Donald Trump took markets by surprise when he mentioned a trade deal with China could be done. If US yields drop off further, expect to see more all-time highs in Gold this week.
GBP/USD holds ground above 1.2600, awaits US data
GBP/USD holds ground above 1.2600 in the European session on Thursday. The pair is helped by a sustained US Dollar weakness but broad risk-off mood due to renewed tariff threats from US President Donald Trump could limit the risk sensitive Pound Sterling. US data is next in focus.
Stellar Price Forecast: XLM’s Total Value Locked reaches over $62 million
Stellar (XLM) price trades inside a channel pattern; a breakout indicates bullish momentum. Crypto intelligence tracker DefiLlama data shows that XLM’s TVL reaches $62 million while the technical outlook projects a target of $0.74.
Money market outlook 2025: Trends and dynamics in the Eurozone, US, and UK
We delve into the world of money market funds. Distinct dynamics are at play in the US, eurozone, and UK. In the US, repo rates are more attractive, and bills are expected to appreciate. It's also worth noting that the Fed might cut rates more than anticipated, similar to the UK. In the eurozone, unsecured rates remain elevated.
The Best brokers to trade EUR/USD
SPONSORED Discover the top brokers for trading EUR/USD in 2025. Our list features brokers with competitive spreads, fast execution, and powerful platforms. Whether you're a beginner or an expert, find the right partner to navigate the dynamic Forex market.