Woolworths Group Limited (WOW) Elliott Wave technical forecast [Video]
![Woolworths Group Limited (WOW) Elliott Wave technical forecast [Video]](https://editorial.fxstreet.com/images/TechnicalAnalysis/ChartPatterns/PointFigure/stock-market-data-18635784_XtraLarge.jpg)
ASX: WOW Elliott Wave technical analysis
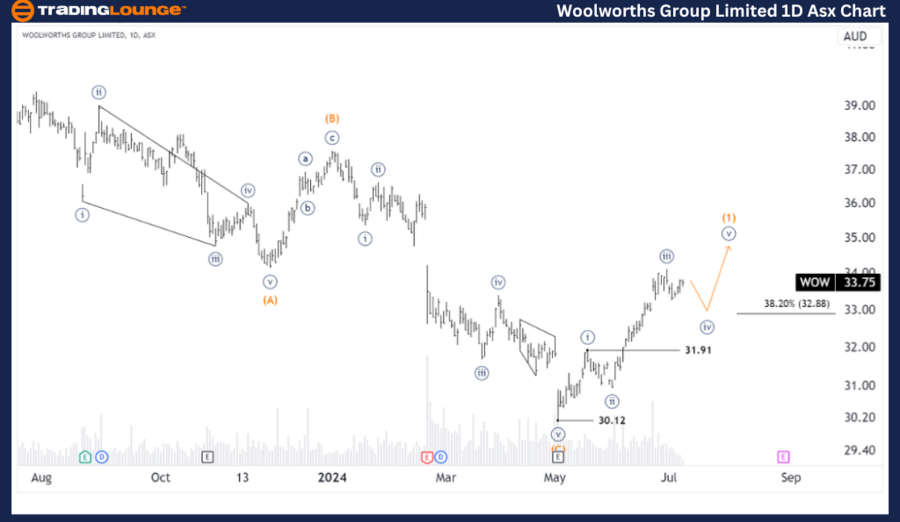
Today's Elliott Wave analysis updates the Australian Stock Exchange (ASX) focusing on Woolworths Group Limited (WOW). Our current observation suggests that wave II (grey) may have concluded, signaling a potential resumption of the longer-term uptrend for WOW. We will monitor the 1D chart for Long Trade Setups.
Analysis function
-
Major trend (Intermediate degree, orange).
-
Mode: Motive.
-
Structure: Impulse.
-
Position: Wave (1) - orange.
Details
-
Wave II (grey) appears to have ended at 30.12.
-
Wave III (grey) has started, pushing higher.
-
Since the low of 30.12, wave (1) (orange) is unfolding.
-
It is subdividing into wave ((iv)) (navy), expected to find support around 32.88.
-
Then wave ((v)) (navy) will likely push higher.
-
Invalidation point: 31.91.
WOW Elliott Wave four-hour chart analysis
Analysis function
-
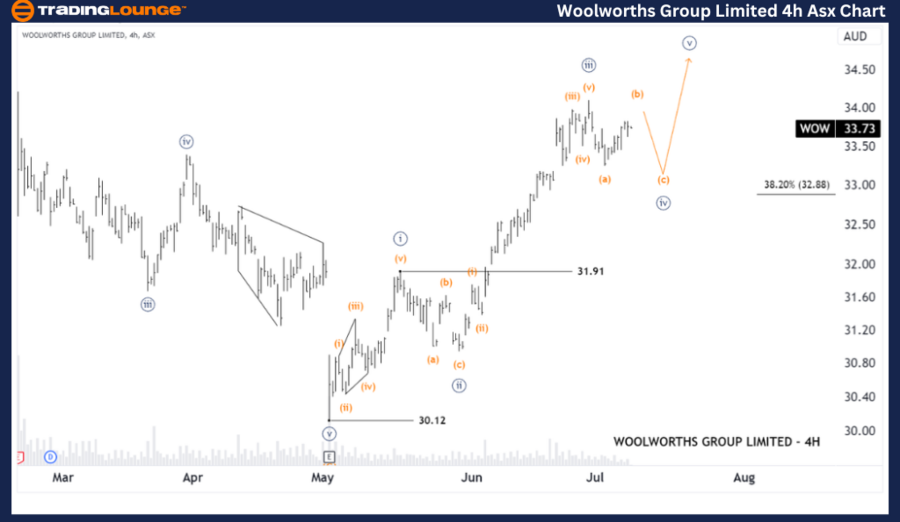
Major trend (Minute degree, navy).
-
Mode: Motive.
-
Structure: Impulse.
-
Position: Wave (b) - orange of Wave ((iv)) - navy.
Details
-
Wave ((iii)) (navy) just ended.
-
Wave ((iv)) (navy) has begun, pushing lower, potentially finding support around 32.88.
-
Once wave ((iv)) is completed, wave ((v)) (navy) is expected to push higher.
-
Invalidation point: 31.91.
Conclusion
Our analysis provides insights into the current market trends for ASX: Woolworths Group Limited (WOW). By identifying specific price points as validation or invalidation signals for our wave count, we aim to enhance confidence in our perspective. Combining these factors allows us to offer an objective and professional view on market trends.
Woolworths Group Limited (WOW) Elliott Wave technical forecast [Video]
Author

Peter Mathers
TradingLounge
Peter Mathers started actively trading in 1982. He began his career at Hoei and Shoin, a Japanese futures trading company.


