Woolworths Group Limited Elliott Wave technical forecast [Video]
![Woolworths Group Limited Elliott Wave technical forecast [Video]](https://editorial.fxstreet.com/images/TechnicalAnalysis/ChartPatterns/PointFigure/stock-market-performance-9668321_XtraLarge.jpg)
ASX: WOW Elliott Wave technical analysis
Greetings, Our Elliott Wave analysis today updates the Australian Stock Exchange (ASX) with WOOLWORTHS GROUP LIMITED - WOW. We see ASX:WOW not really rising, but still has a push lower.
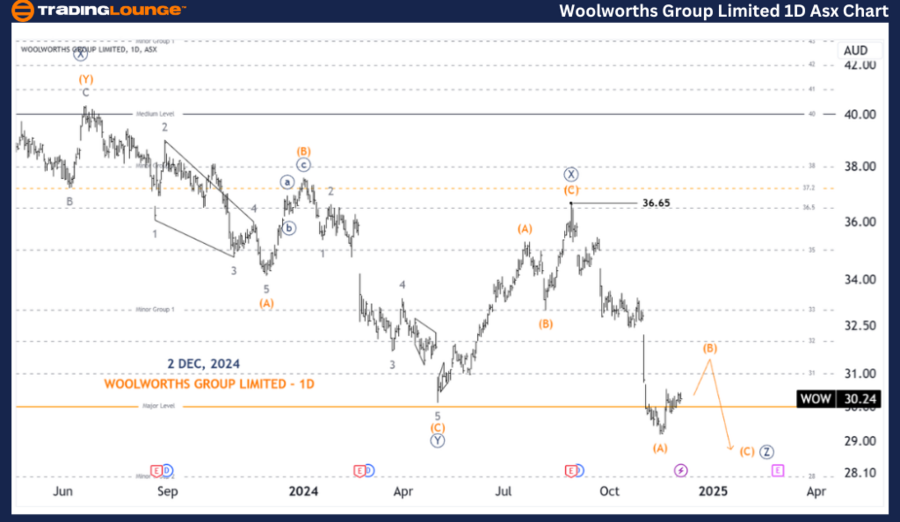
ASX: WOW one-day chart (semilog scale) analysis
Function: Major trend (Primary degree, navy).
Mode: Motive.
Structure: Impulse.
Position: Wave (B)-orange of Wave ((Z))-navy.
Details: Wave II-grey continued longer than expected and pushed lower as a Triple Zigzag, targeting the low around 27.38. There is probably still a push lower with wave (C)-orange. Then when price pushes higher above 36.65 it is the first step to show that a correction wave is completed, and we can move higher.
Invalidation point: 36.65.
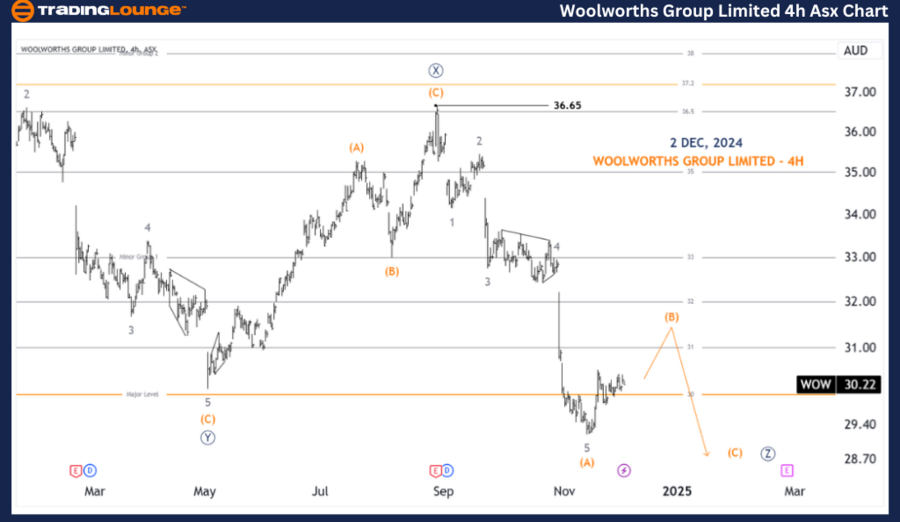
ASX: WOW four-hour chart analysis
Function: Major trend (Primary degree, navy).
Mode: Motive.
Structure: Impulse.
Position: Wave (B)-orange of Wave ((Z))-navy.
Details: There is probably still a push lower with wave (C)-orange. Perhaps there is still a push lower with the (C)-orange wave. Since I see the (A)-orange wave completing the five-waves within the ((Z))-navy wave, perhaps a little more push higher is needed with the (B)-orange wave, and then another five-wave lower.
Invalidation point: 36.65.
Conclusion
Our analysis, forecast of contextual trends, and short-term outlook for ASX: WOOLWORTHS GROUP LIMITED - WOW aim to provide readers with insights into the current market trends and how to capitalize on them effectively. We offer specific price points that act as validation or invalidation signals for our wave count, enhancing the confidence in our perspective. By combining these factors, we strive to offer readers the most objective and professional perspective on market trends.
Woolworths Group Limited Elliott Wave technical forecast [Video]
Author

Peter Mathers
TradingLounge
Peter Mathers started actively trading in 1982. He began his career at Hoei and Shoin, a Japanese futures trading company.


