Will the US presidential election crash the stock market?

If there is one thing the financial markets do not like, it is uncertainty. Of course, who will become the next President of the United States of America is often a considerable uncertainty, especially in the 2024 elections with two opposite candidates. Since the President of the USA wields great economic power at home and abroad, and the stock market is an economic barometer, it is paramount to ask if the outcome of the elections can crash the US stock market.
To answer that question, we should first go back to our previous update from three weeks ago, where we found that the index
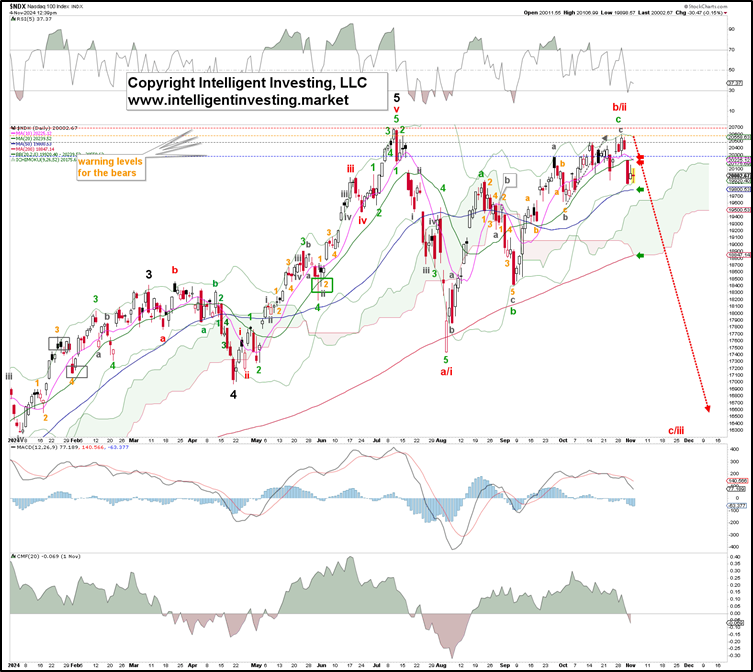
“… the index could still be wrapping up a counter-trend rally: the red W-b/ii, potentially targeting as high as $20600, assuming a standard (grey) W-c = W-a relationship. A break below the grey W-b, the October 1 low at $19622, would go a long way to confirm this thesis, with full confirmation below the September 6 low at $18400.”
Fast-forward: The index topped at $20,600.01 last Tuesday, October 29, and has since declined. Thus, the counter-trend red W-b/ii, see Figure 1 below, is still alive and well, but the Bears have yet to push the index’s price even below the October 1 low. Thus, while we keep the warning levels for the Bears as is, we still cannot exclude the Bullish potential setup in the charts. Allow us to explain below.
Figure 1. NDX daily chart with detailed Elliott Wave count and technical indicators
Before the bears get too excited, please note that
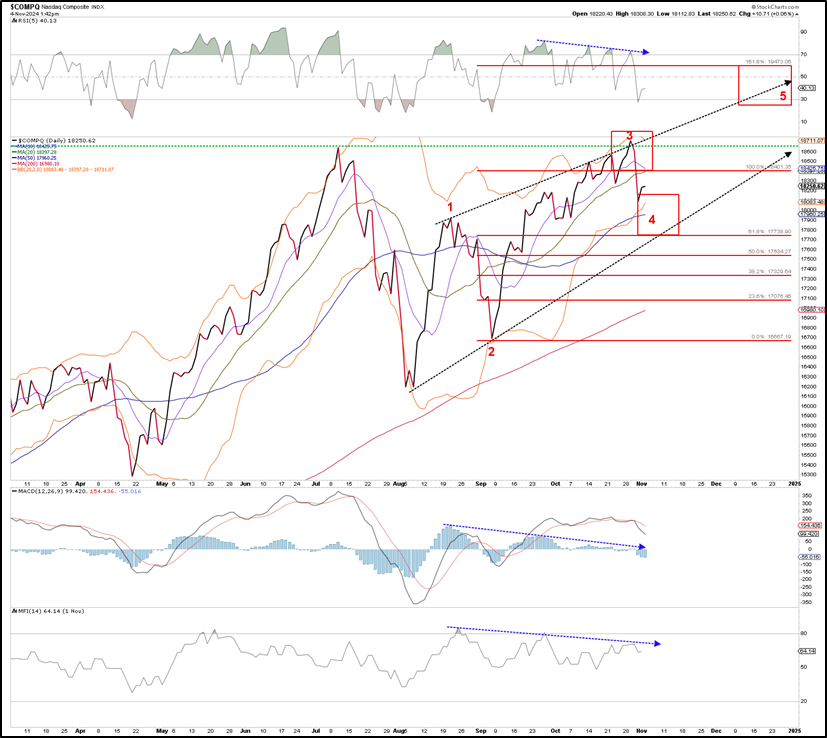
A) The NASDAQ (NAS) made a new all-time high (ATH) last week, which excludes the red W-b/ii setup for that index. Since the NDX and NAS are often tied to the hip, it is uncommon for the two to have vastly differing EWP counts. Namely, as explained in our previous update, if the Bears cannot hold the index's price below the July ATH, we must focus on the alternative EWP count in Figure 2 below, which is the “dreaded” ending diagonal (ED).
Figure 2. NASDAQ daily chart with detailed Elliott Wave count and technical indicators
As explained in our previous update,
“In an ED, the 3rd wave … typically targets the 1.236x Fibonacci extension of the [1st wave], measured from the [2nd wave] low, … . From there, a correction, [the 4th wave], can target typically, but not necessarily, the 61.8-76.4% Fib-extension … before the [5th wave] kicks in, to ideally the 161.8-176.4% Fib-extension … .”
This also applies to the NASDAQ. Figure 2 shows that it is following this ED pattern rather well. This path is contingent on holding above the September 6 low, though the potential 4th wave, as shown, can become more protracted, i.e., a bounce followed by another move lower before the final 5th wave starts.
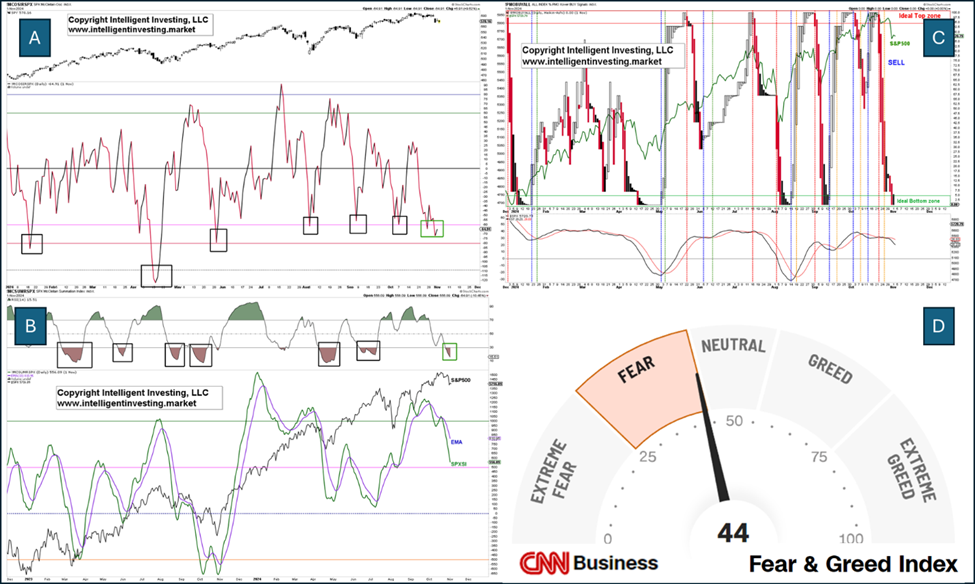
B) Market breadth readings and sentiment are getting pretty washed out. See Figure 3 below. Although these are conditions, i.e., these readings can always become lower, and the indexes’ price is always the final arbiter, the McClellan Oscillator (3A), Summation Index (3B), and PMO (3C) are all at levels from where previously good buy signals occurred. Meanwhile, sentiment is fearful. Thus, the path of least resistance for these indicators appears to be up, which can propel the indexes higher.
Figure 3. Several market breadth indicators and the CNN Fear & Greed Index
The bottom line is that the Bears stopped the advance right where they had to (NDX20,600) and still have a shot at hammering out a multi-year top. However, a break below at least the October 1 low, especially the September 6 low, is required to confirm this thesis. Otherwise, the Bulls can run with it. Meanwhile, market breadth and sentiment are getting pretty washed out, which favors the Bulls, if only for a “dead cat bounce.”
Author

Dr. Arnout Ter Schure
Intelligent Investing, LLC
After having worked for over ten years within the field of energy and the environment, Dr.


