Will S&P 500 break above 5,000 today?

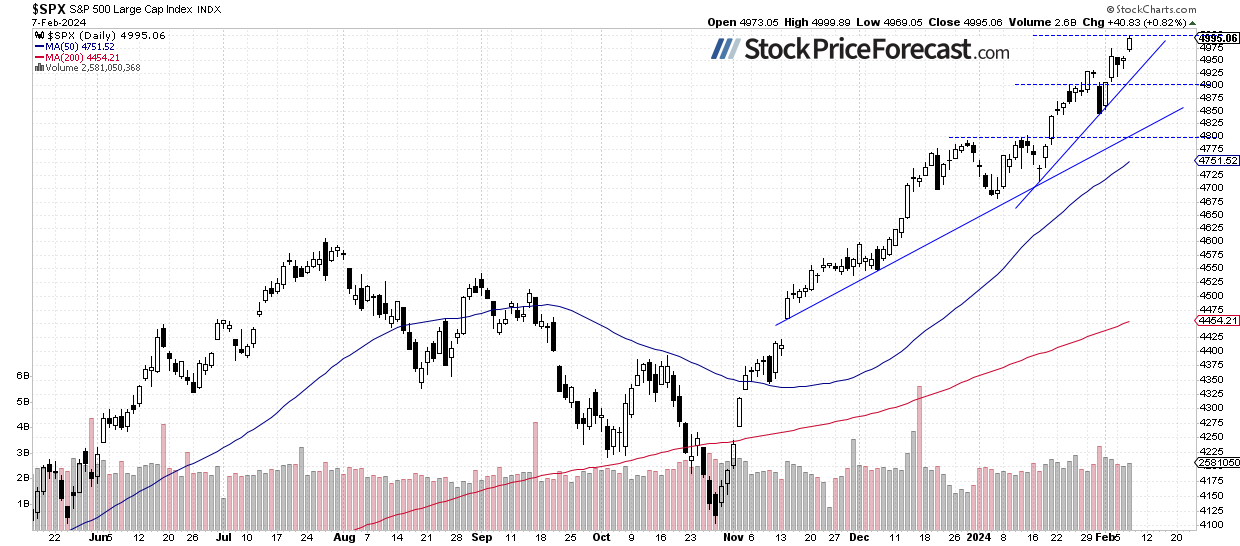
Stocks broke out of a short-term consolidation yesterday and reached new highs in a reaction to improving economic data and strong corporate earnings. The S&P 500 index set new record high at the level of 4,999.89, gaining 0.82% at the end of the day.
Recently, my short-term outlook was still neutral because the market seemed overbought and ready for a downward correction. When in doubt, it’s better to stay out of a position than to try to catch a top and open a short position too early.
Although a downward correction is widely expected, the overall market sentiment remains bullish, and the index may have another opportunity to reach new records above the psychologically significant 5,000 level. This morning, futures contracts indicate that stocks are likely to open 0.2% lower.
Investor sentiment remains very elevated; yesterday’s AAII Investor Sentiment Survey showed that 49.0% of individual investors are bullish, while only 22.6% of them are bearish. The AAII sentiment is a contrary indicator in the sense that highly bullish readings may suggest excessive complacency and a lack of fear in the market. Conversely, bearish readings are favorable for market upturns.
Last Tuesday, I wrote that “Despite new highs, it seems that a correction scenario is likely in the near term. (…) caution may be advised, as a correction or consolidation could occur at some point.” The prediction proved correct until Thursday when the market began rallying again. However, today, the same statement remains very true, as the market still appears overbought in the short term.
Yesterday, I mentioned that “We may have to deal with a correction or consolidation of several weeks of advances. With the season of quarterly earnings announcements coming to an end and a series of important economic data, profit taking may follow.”
The S&P 500 is likely to retrace some of its yesterday’s breakout this morning; however, there have been no confirmed negative signals thus far. Yesterday, it broke above a short-term consolidation, as we can see on the daily chart.
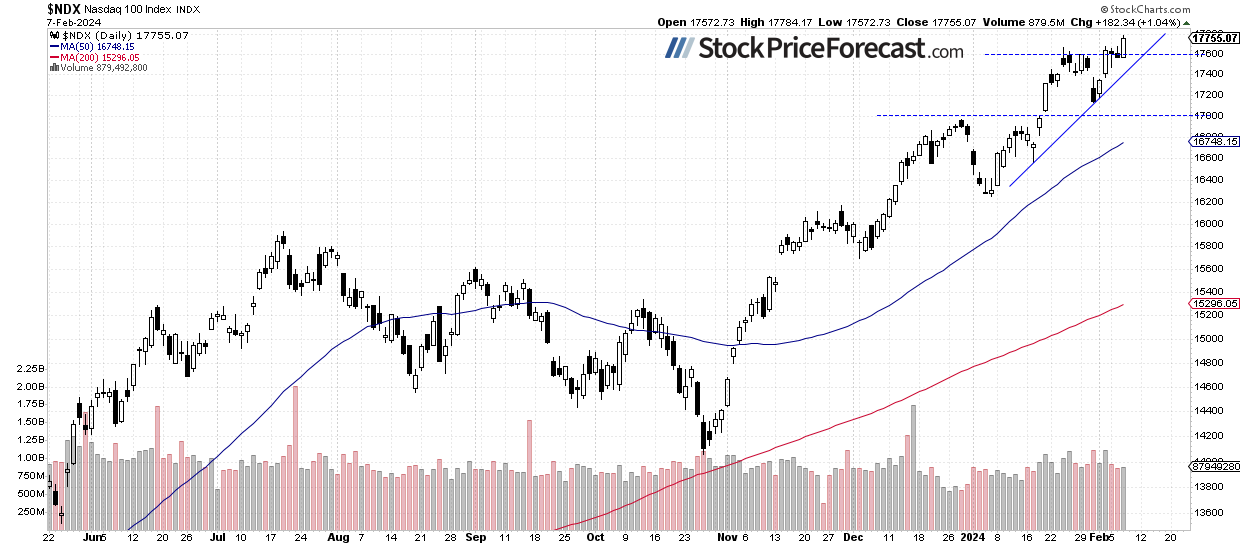
Nasdaq hits new record too
The technology-focused Nasdaq 100 index reached a new all-time high at 17,784.17 yesterday. Recently, it has been relatively weaker than the broader stock market, but yesterday it caught up with the S&P 500. However, Nasdaq’s rally was led by a handful of “FANG” stocks like META, NVDA and MSFT. Yesterday, I wrote about the NYSE FANG+ index.
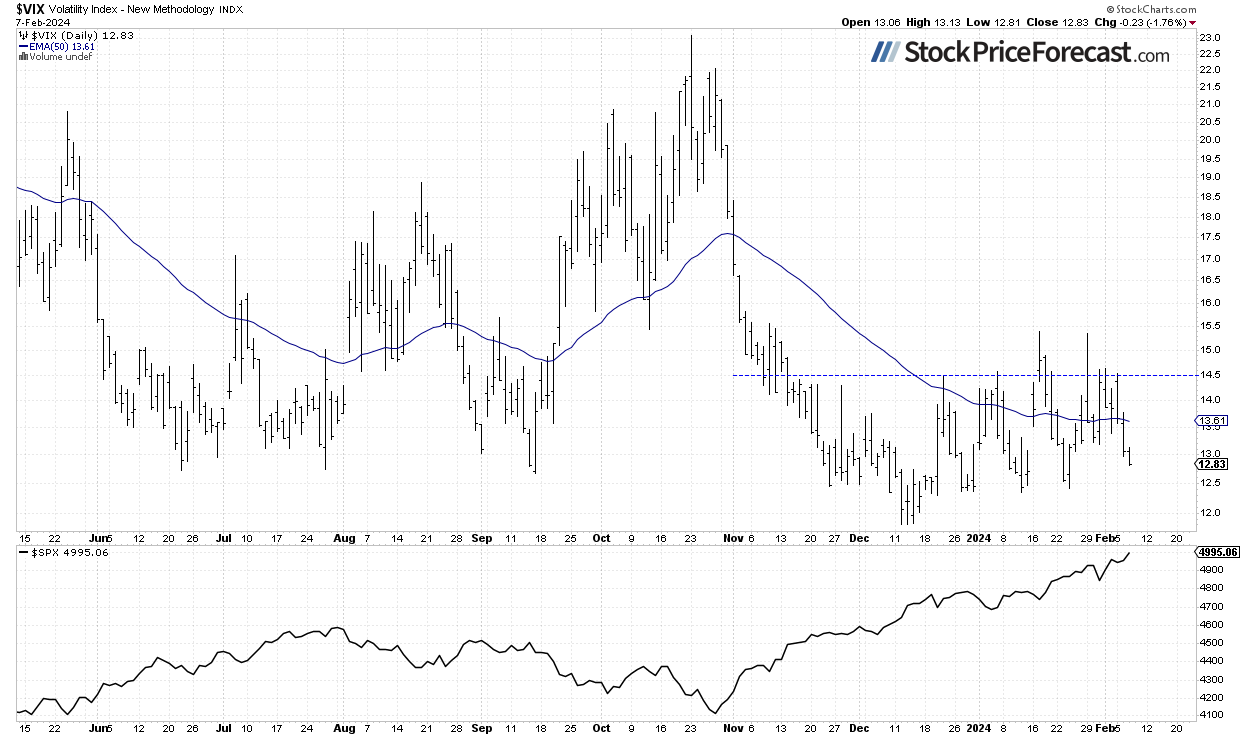
VIX is below 13
The VIX index, also known as the fear gauge, is derived from option prices. Yesterday, it fell below the 13 level, indicating a lack of fear in the market as stock prices reached record highs.
Historically, a dropping VIX indicates less fear in the market, and rising VIX accompanies stock market downturns. However, the lower the VIX, the higher the probability of the market’s downward reversal.
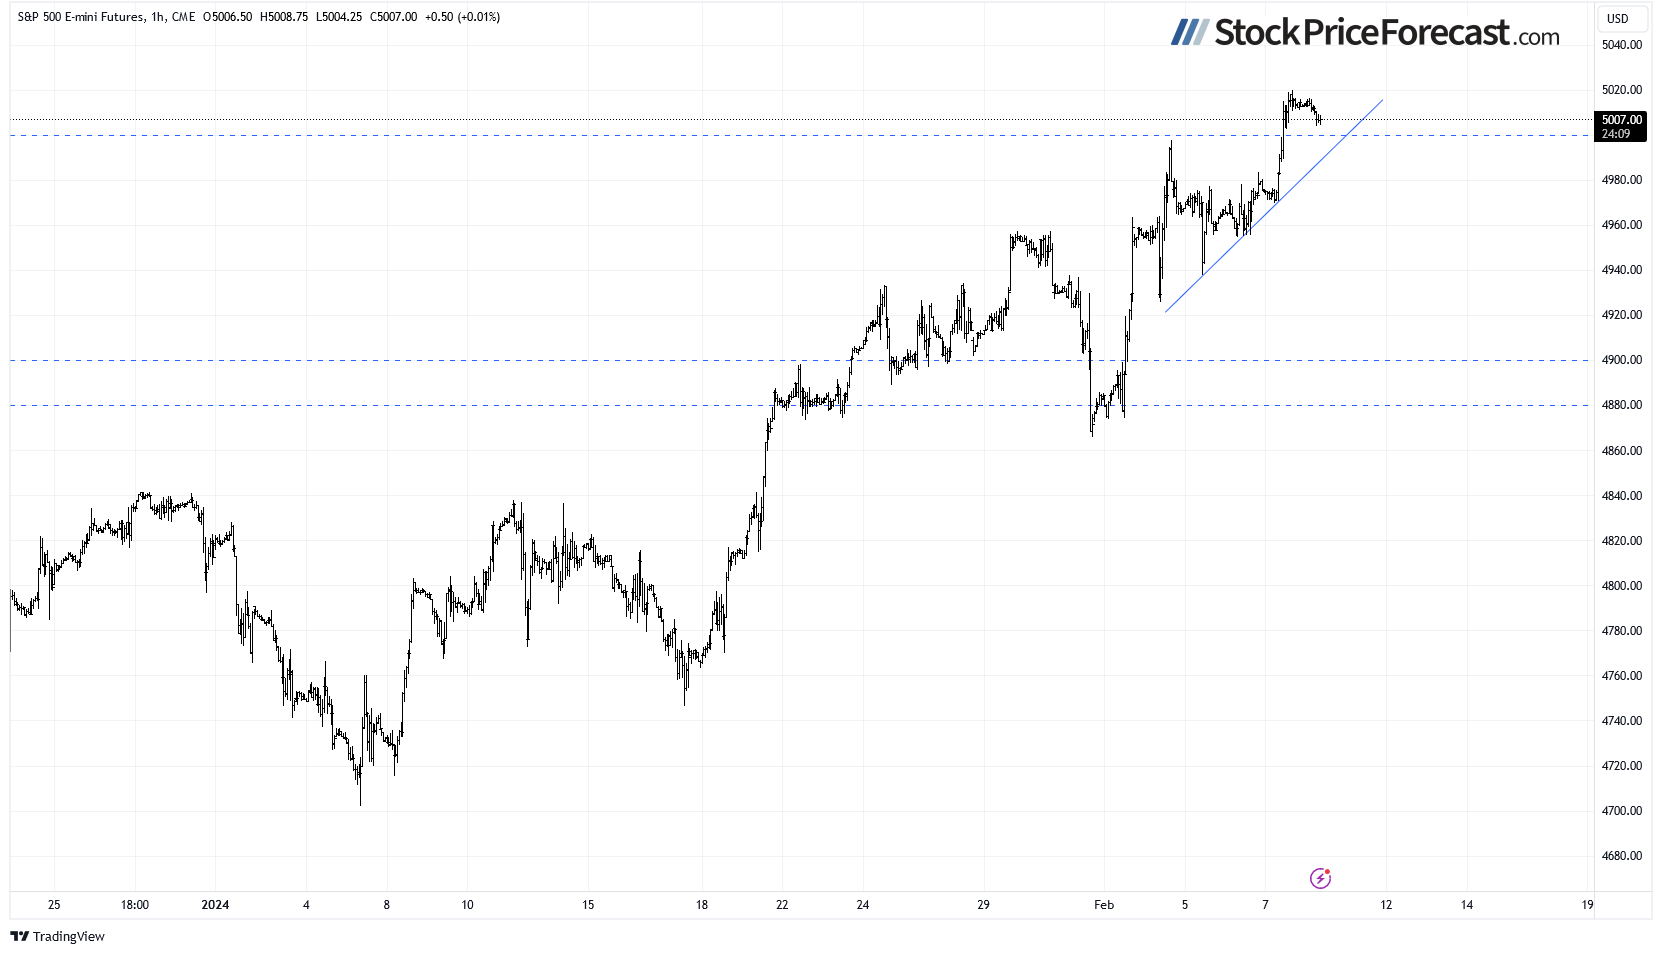
Futures contract remains above 5,000
Let’s take a look at the hourly chart of the S&P 500 futures contract. This morning, it’s trading above the 5,000 level. The resistance level is now at 5,020, while the support stands at 4,980, among others.
Conclusion
Investor sentiment remains very bullish, with few bears in the market currently, as indicated by yesterday’s AAII Sentiment reading. Although the market is likely to open slightly lower today, the S&P 500 index may attempt to break above the 5,000 level, which it almost reached yesterday. However, in the short term, the possibility of a downward correction cannot be overlooked. A quick glance at the chart reveals that the S&P 500 index has recently become more volatile.
On December 21, I mentioned that “in a short-term the market may see some more uncertainty and volatility”, and indeed, there was a lot of uncertainty following the early-December rally and the breakout of the S&P 500 above the 4,700 level. However, the previous week’s price action left no illusions of a potential medium-term trend reversal. On Tuesday, I noted that “The market is overbought in the short term, but predicting a correction is currently very challenging.”. This still holds true; Wednesday’s rout was very short-lived, as bulls came back with a vengeance on Thursday and Friday. Yesterday, the market rallied even further.
For now, my short-term outlook remains neutral.
Here’s the breakdown
-
The S&P 500 is expected to retrace some of yesterday's gains, but there may be attempts to break above the 5,000 level.
-
The market appears overbought in the short term, but no negative signals are evident.
-
In my opinion, the short-term outlook is neutral.
Want free follow-ups to the above article and details not available to 99%+ investors? Sign up to our free newsletter today!
Want free follow-ups to the above article and details not available to 99%+ investors? Sign up to our free newsletter today!
Author

Paul Rejczak
Sunshine Profits
Paul Rejczak is a stock market strategist who has been known for the quality of his technical and fundamental analysis since the late nineties.


