Will NU continue rally after unusual volume activity last week?

NU Holdings Ltd., (NU) provides digital banking platform in Brazil, Mexico, Colombia, Germany, Argentina, United States & Uruguay. It offers spending solutions comprising credit & prepaid cards, mobile payment solutions & integrated mall that enables customers to purchase goods & services from various ecommerce retailers. It is based in Brazil, comes under Financial services sector & trades as “NU” ticker at NYSE.
NU favors bullish I impulse sequence started from June-2022 low of $3.26. It already made new high above December-2021 & expect pullback to remain supported in 3, 7 or 11 swings.
NU – Elliott Wave latest weekly view
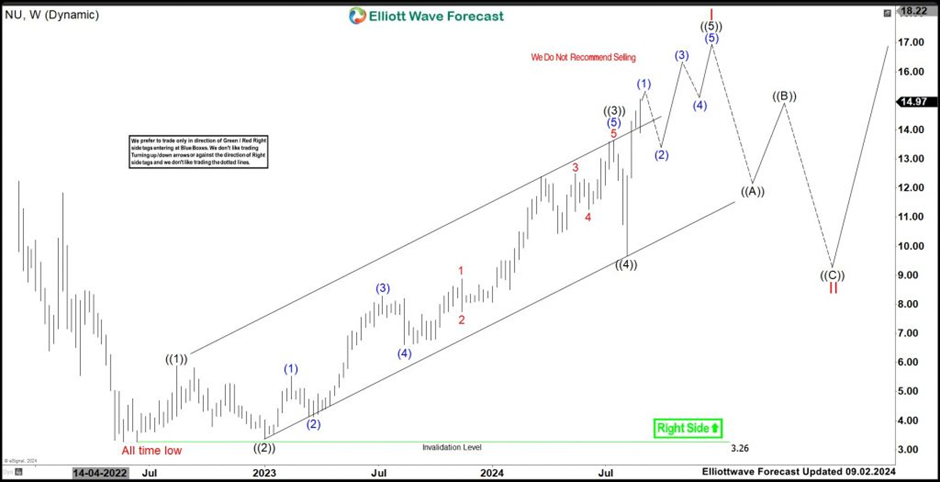
It is showing 5 swings higher since June-2022 low as impulse sequence in weekly with third wave extension. Above all time low, it placed ((1)) of I at $5.88 high & ((2)) at $3.39 low as dip pullback. It started ((3)) as extended sequence, which ended at $13.64 high. Within ((3)), it placed (1) at $5.53 high, (2) at $4.13 low, (3) at $8.29 high, (4) at $6.61 low & finally (5) extended wave at $13.64 high. Later, it finished ((4)) as sharp correction at $9.67 low on 5-August-2024. Above $9.67 low, it favors upside in ((5)) of I & expect short term pullback in 3, 7 or 11 swings to extend higher to finish I.
It traded with unusual high volume in last trading session, which provides few scenarios. (1st scenario) It can extend higher, while dips remain above ((4)) low as ((5)) while momentum divergence remains intact to finish I towards $14.59 – $16.11 area. (2nd scenario) It can be ended I at last peak, which confirms, when price fails to make new high in few sessions & later breaks below $9.67 low. (3rd scenario) It will extend higher & erase the momentum divergence to confirm the upside as nest & manage to trade above price channel. In either the scenarios, we like to buy the pullback in 3, 7 or 11 swings at extreme areas.
Author

Elliott Wave Forecast Team
ElliottWave-Forecast.com


