|

Will NextEra Energy (NEE) continue bullish trend or correcting lower?

NextEra Energy, Inc., (NEE) is an American Energy company through its subsidiaries generates, transmits, distributes & sells electric power to retail & wholesale customers in North America. The company generates electricity, through wind, solar, nuclear, natural gas & other clean energy. It is based in June Beach, Florida, comes under Utility sector & trades as “NEE” ticker at NYSE.

In daily, it favors upside from October-2023 low & confirms bullish sequence, when break above $93.73 high. Currently, it favors upside in ((5)) to finish I & soon will starts correcting in II in 3, 7 or 11 swings pullback.

NEE – Elliott Wave latest weekly view 

Chart

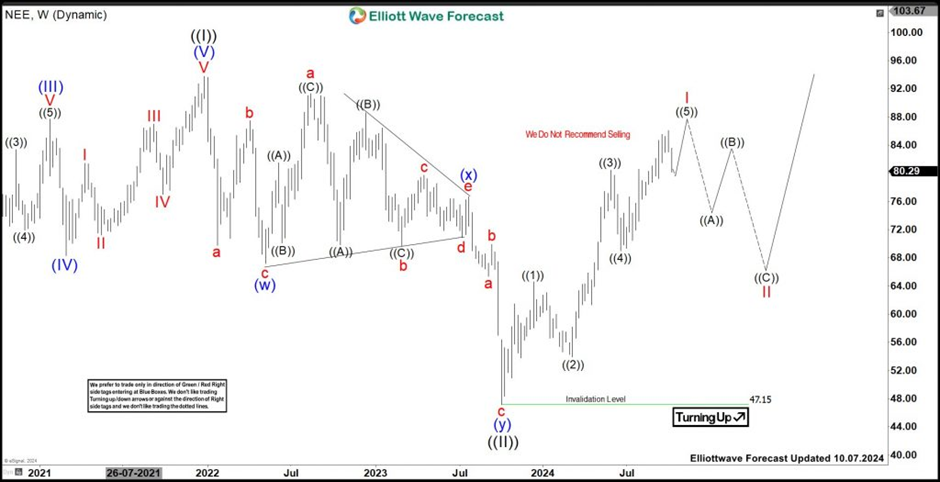
In Monthly sequence, it ended ((I)) at $93.73 high in December-2021, since its inception. It corrected lower in ((II)) as double correction, which ended at $47.15 low in October-2023 low. Within ((II)), it placed (w) at $67.22 low, (x) at 76.67 high as triangle structure & (y) at $47.15 low.

Above ((II)) low, it favors upside in I of (I) of ((III)) & need to break above $93.73 high to confirm the bullish sequence. Above $47.15 low, it placed ((1)) of I at $64.59 high as diagonal, ((2)) at $53.95 low, ((3)) at $80.47 high & ((4)) at $68.97 low. Currently, it favors upside in ((5)) started from June-2024 low & expect small upside to finish I while high comes with momentum divergence. Later, it should correct in II in 3, 7 or 11 swings against October-2023 low before resume higher. If it extends higher & erase the momentum divergence, then it will be nesting in (I). We like to buy the pullback in 3, 7 or 11 swings, once it confirms bullish sequence. Until it breaks above December-2021 high, it can remain choppy or do larger double correction in ((II)), if breaks below $47.15 low.

Author

Elliott Wave Forecast Team

Elliott Wave Forecast Team

ElliottWave-Forecast.com

More from Elliott Wave Forecast Team
Share:

Editor's Picks

EUR/USD flirts with daily highs, retargets 1.1900

EUR/USD regains upside traction, returning to the 1.1880 zone and refocusing its attention to the key 1.1900 barrier. The pair’s slight gains comes against the backdrop of a humble decline in the US Dollar as investors continue to assess the latest US CPI readings and the potential Fed’s rate path.

GBP/USD remains well bid around 1.3650

GBP/USD maintains its upside momentum in place, hovering around daily highs near 1.3650 and setting aside part of the recent three-day drop. Cable’s improved sentiment comes on the back of the Greenback’s  irresolute price action, while recent hawkish comments from the BoE’s Pill also collaborate with the uptick.

Gold clings to gains just above $5,000/oz

Gold is reclaiming part of the ground lost on Wednesday’s marked decline, as bargain-hunters keep piling up and lifting prices past the key $5,000 per troy ounce. The precious metal’s move higher is also underpinned by the slight pullback in the US Dollar and declining US Treasury yields across the curve.

Crypto Today: Bitcoin, Ethereum, XRP in choppy price action, weighed down by falling institutional interest 

Bitcoin's upside remains largely constrained amid weak technicals and declining institutional interest. Ethereum trades sideways above $1,900 support with the upside capped below $2,000 amid ETF outflows.

Week ahead – Data blitz, Fed Minutes and RBNZ decision in the spotlight

US GDP and PCE inflation are main highlights, plus the Fed minutes. UK and Japan have busy calendars too with focus on CPI. Flash PMIs for February will also be doing the rounds. RBNZ meets, is unlikely to follow RBA’s hawkish path.

Ripple Price Forecast: XRP potential bottom could be in sight

Ripple edges up above the intraday low of $1.35 at the time of writing on Friday amid mixed price actions across the crypto market. The remittance token failed to hold support at $1.40 the previous day, reflecting risk-off sentiment amid a decline in retail and institutional sentiment.