Since its stock became available for trading, FTNT has continued to make profits for its investors. Similarly, speculators have been able to find positions from pullbacks as the stock has maintained a bullish sequence since 2009. This blog post will reveal when traders can jump into another trade from the dip. This is from the perspective of the Elliott wave theory as we see it.

Fortinet, Inc. (FTNT) is a leading cybersecurity company known for providing a wide range of security solutions, including firewalls, antivirus, intrusion prevention, and endpoint security. Founded in 2000 by Ken Xie, the company is headquartered in Sunnyvale, California. Fortinet’s flagship product is the FortiGate firewall, but it also offers a broad portfolio of products covering areas such as cloud security, network security, and advanced threat protection.

Fortinet went public in 2009 and trades on the NASDAQ under the ticker symbol FTNT. The company has consistently shown strong revenue growth, driven by the increasing demand for cybersecurity solutions in the face of rising cyber threats. It serves a global customer base across various industries, including government, healthcare, finance, and education.

FTNT Elliott Wave analysis, weekly chart – 08.28.2024

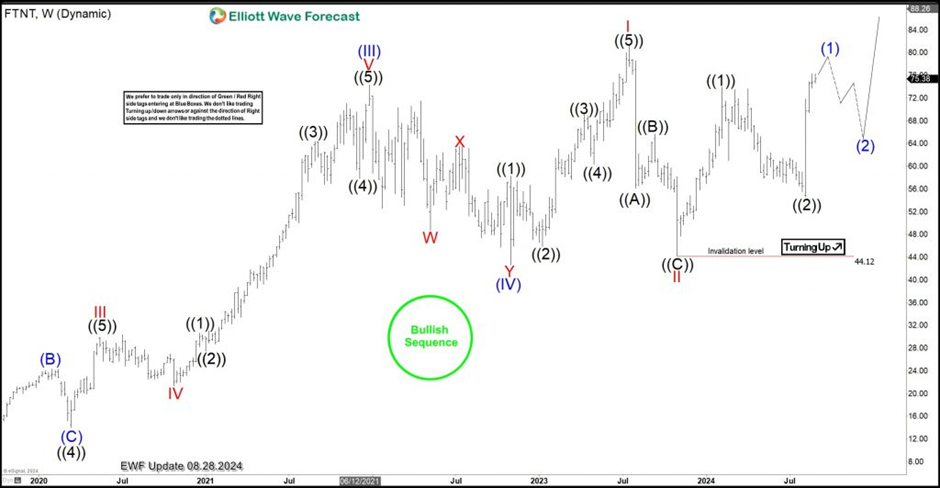
The weekly chart above shows the bullish sequence from the all-time low. A clear impulse sequence is evolving for the grand supercycle degree wave ((I)). The impulse structure already completed the supercycle degree waves (III) and (IV) of ((I)) in December 2021 and October 2022 respectively. From the low of October 2022, the stock prices rallied again to break above the December 2022 high and reached a fresh all-time high in July 2023. The top of July 2023 marked the start of wave (V) of ((I)) as wave I of (V). A corrective zigzag pullback followed as wave II of (V) of ((I)) at 44.12. Wave III is already progressing upwards and should make an impulse rally into a fresh all-time high.

FTNT Elliott Wave analysis, H4 chart – 08.28.2024

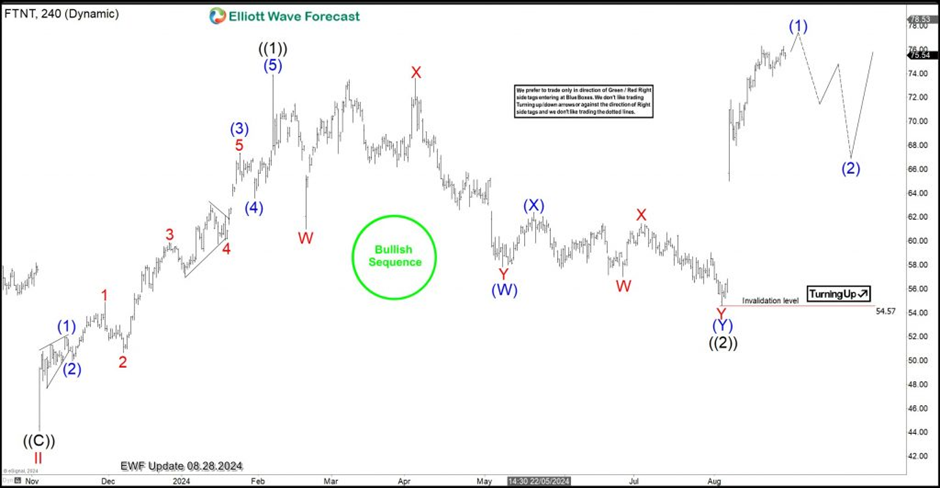
On the H4 chart, Wave ((1)) and ((2)) of III have been completed. Price is now in wave ((3)) of III which should reach at least 92.5 and ideally 127.8. Each pullback, either in wave (IV), II or even ((2)), presented buyers the opportunity to enter LONG positions at lower prices. What we can notice is that each of these pullbacks either completed a 3 or 7 swings corrective sequence. This is typical of corrective structures. As the price breached wave ((1)) high, we can confirm ((2)) has finished. The most recent surge from 08.05.2024 can now be wave (1) of ((3)). Therefore, buyers will find opportunities again at the end of the wave 2 pullback, especially in the lower time frames.

Share: Feed news

FURTHER DISCLOSURES AND DISCLAIMER CONCERNING RISK, RESPONSIBILITY AND LIABILITY Trading in the Foreign Exchange market is a challenging opportunity where above average returns are available for educated and experienced investors who are willing to take above average risk. However, before deciding to participate in Foreign Exchange (FX) trading, you should carefully consider your investment objectives, level of xperience and risk appetite. Do not invest or trade capital you cannot afford to lose. EME PROCESSING AND CONSULTING, LLC, THEIR REPRESENTATIVES, AND ANYONE WORKING FOR OR WITHIN WWW.ELLIOTTWAVE- FORECAST.COM is not responsible for any loss from any form of distributed advice, signal, analysis, or content. Again, we fully DISCLOSE to the Subscriber base that the Service as a whole, the individual Parties, Representatives, or owners shall not be liable to any and all Subscribers for any losses or damages as a result of any action taken by the Subscriber from any trade idea or signal posted on the website(s) distributed through any form of social-media, email, the website, and/or any other electronic, written, verbal, or future form of communication . All analysis, trading signals, trading recommendations, all charts, communicated interpretations of the wave counts, and all content from any media form produced by www.Elliottwave-forecast.com and/or the Representatives are solely the opinions and best efforts of the respective author(s). In general Forex instruments are highly leveraged, and traders can lose some or all of their initial margin funds. All content provided by www.Elliottwave-forecast.com is expressed in good faith and is intended to help Subscribers succeed in the marketplace, but it is never guaranteed. There is no “holy grail” to trading or forecasting the market and we are wrong sometimes like everyone else. Please understand and accept the risk involved when making any trading and/or investment decision. UNDERSTAND that all the content we provide is protected through copyright of EME PROCESSING AND CONSULTING, LLC. It is illegal to disseminate in any form of communication any part or all of our proprietary information without specific authorization. UNDERSTAND that you also agree to not allow persons that are not PAID SUBSCRIBERS to view any of the content not released publicly. IF YOU ARE FOUND TO BE IN VIOLATION OF THESE RESTRICTIONS you or your firm (as the Subscriber) will be charged fully with no discount for one year subscription to our Premium Plus Plan at $1,799.88 for EACH person or firm who received any of our content illegally through the respected intermediary’s (Subscriber in violation of terms) channel(s) of communication.

Recommended content


Recommended content

Editors’ Picks

AUD/USD: The hunt for 0.6870

AUD/USD: The hunt for 0.6870

AUD/USD resumed its uptrend despite the better tone in the greenback, managing to reclaim the key 0.6800 barrier and beyond and refocusing on the next up-barrier at the 0.6870 region (December 2023 peaks).

AUD/USD News
EUR/USD: Initial contention emerges around 1.1050

EUR/USD: Initial contention emerges around 1.1050

EUR/USD built on Wednesday’s losses and retreated below the 1.1100 support, finding some initial contention around 1.1050 on the back of the continuation of the upside impetus in the US Dollar prior to Friday’s PCE data.

EUR/USD News
Gold aims for fresh record highs

Gold aims for fresh record highs

Following a quick drop toward $2,500 in the American session on Thursday with the immediate reaction to upbeat US data releases, Gold regains its traction and trades in positive territory at around $2,520.

Gold News
Bitcoin pops above $60,000, but the short-term outlook remains bearish

Bitcoin pops above $60,000, but the short-term outlook remains bearish

Bitcoin's (BTC) price recovers from Wednesday's losses and trades higher by 2.3% at $60,320 at the time of writing on Thursday. However, the recovery could be short-lived as on-chain metrics project a negative outlook, as shown by negative exchange funding rates.

Read more
Three fundamentals for the week: Focus on the fragility of the US economy

Three fundamentals for the week: Focus on the fragility of the US economy Premium

US Consumer confidence data will provide a gauge of how consumers are feeling. Jobless claims are in focus after Fed Chair Powell's dovish speech. Investors will look to the core PCE index to confirm that inflation is falling.

Read more
Moneta Markets review 2024: All you need to know

Moneta Markets review 2024: All you need to know

VERIFIED In this review, the FXStreet team provides an independent and thorough analysis based on direct testing and real experiences with Moneta Markets – an excellent broker for novice to intermediate forex traders who want to broaden their knowledge base.

Read More

Forex MAJORS

Cryptocurrencies

Signatures