Why it’s not just Nvidia driving the market

The best performing stock on the S&P 500 so far this year is Nvidia. It has risen nearly 60% YTD, followed by Meta, which is the second best-performing stock, and is up more than 36% in 2024. There’s a lot of media coverage about the tech sector and how it is driving the overall market. However, if you dig a bit deeper into the performance data, then you realize that the stock price rally is broader than just tech, not just in 2024, but also in the last 12 months.
Eli Lily, the pharma giant, is the third best performing stock in the S&P 500 so far in 2024 and is up 32%. Ralph Lauren, the affordable luxury clothing giant, is up 29% YTD, and is the fifth best performing stock on the index. This busts the myth that tech is the only driving force that has helped the US stock market to reach record highs. The tech sector is certainly playing its part, but it makes up nearly 30% of the S&P 500, so one would expect tech companies to rise in line with the overall index. The healthcare sector, pharma, movies and entertainment, broadline retail and the oil and gas sectors are all experiencing double digit returns so far this year.
Chart one: Winners and losers in the S&P 500 YTD
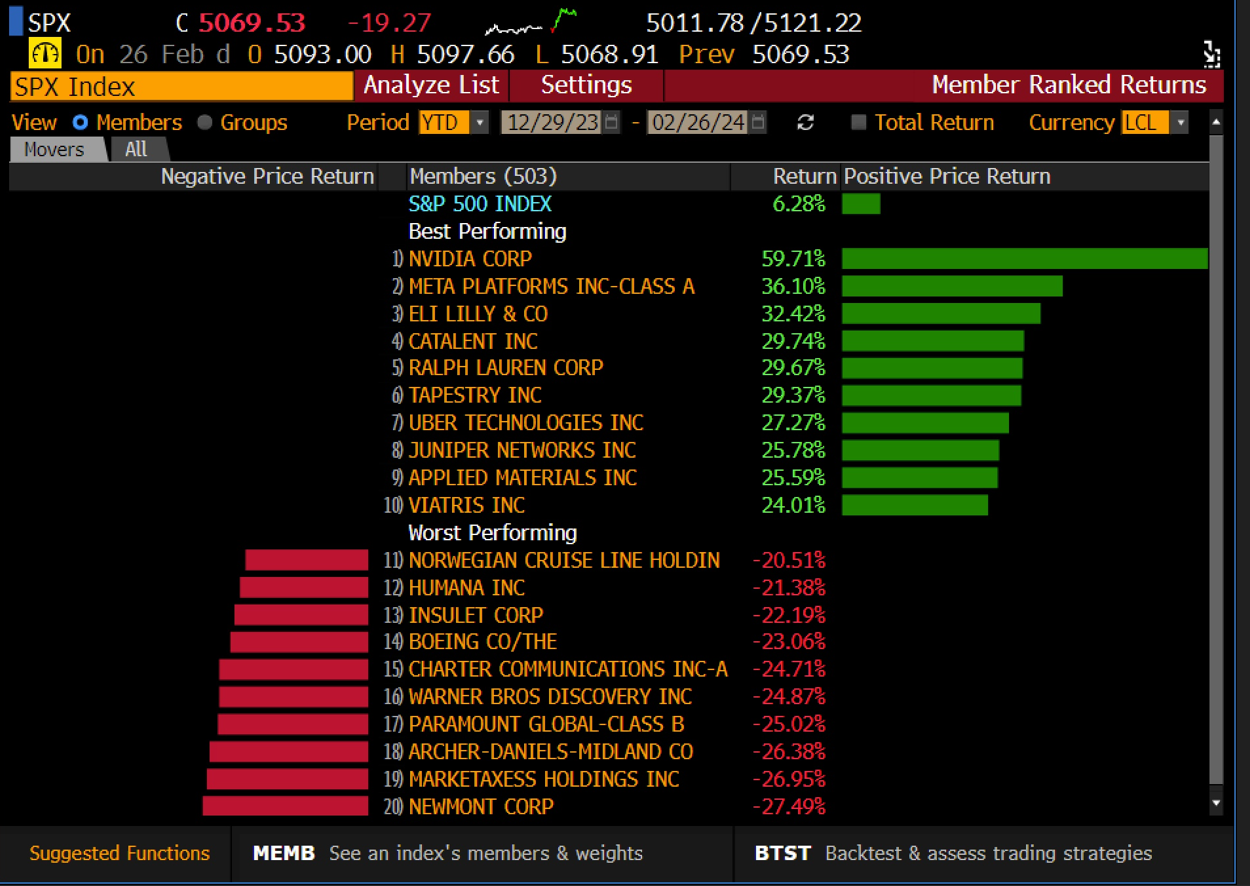
Source: XTB and Bloomberg
Healthcare makes up 12.7% of the S&P 500, and consumer discretionary, which includes Ralph Lauren, makes up 10%, a third of the size of the IT sector. When you put it into perspective, there are plenty of other stocks and sectors outside of tech that are pulling their weight, and they also helped the S&P 500 to rise above 5,000.
On an annual basis, the same theory holds – US stock market performance is not just driven by tech. In the last 12 months, the S&P 500 semi-conductor index is up 119%, largely driven by Nvidia and other AI stocks. However, the retail sector is up 73% and is the fourth best performing sector in the index over the last 12 months. The homebuilding sector is higher by 63% in the last 12 months, and construction materials are also up by 42%. While the performance of the semiconductor sector dwarves the performance elsewhere, these are still very strong returns, which shows that the stock market performance is broad-based, even if tech is having an exceptional rally. On an individual stock basis, Nvidia is still the best performer in the last 12 months, however, Eli Lily comes third and Builders Firstsource, a building supplies company, is the fourth best performing stock in the US blue chip index in the last 12 months.
Equal-weighted S&P 500 index follows overall index higher
It is also worth noting that most of the weakest performers are non-tech companies on a 12-month and a YTD basis. The weakest sector on the S&P 500 so far this year is the gold index, followed by agricultural products, which are lower by 27% and 21% respectively. On a 12-month basis, the weakest performers on a sectoral basis are personal care, down 45%, and the drug retail sector, down 41%. Regional banks are also a drag on the index, and this sector is lower by 33% in the last 12 months. Since it is mostly non-tech stocks that are the weakest performers in the S&P 500, the fact that the equal weighted S&P 500 has been able to follow the market-cap weighted S&P 500 higher, albeit with lower rates of return, is impressive, since the equal weighted index has more sectors and stocks that are a drag on performance.
Chart two: S&P 500 market capitalization weighted index, and the S&P 500 equal weighted index, this data has been normalized to show how the two indices move together
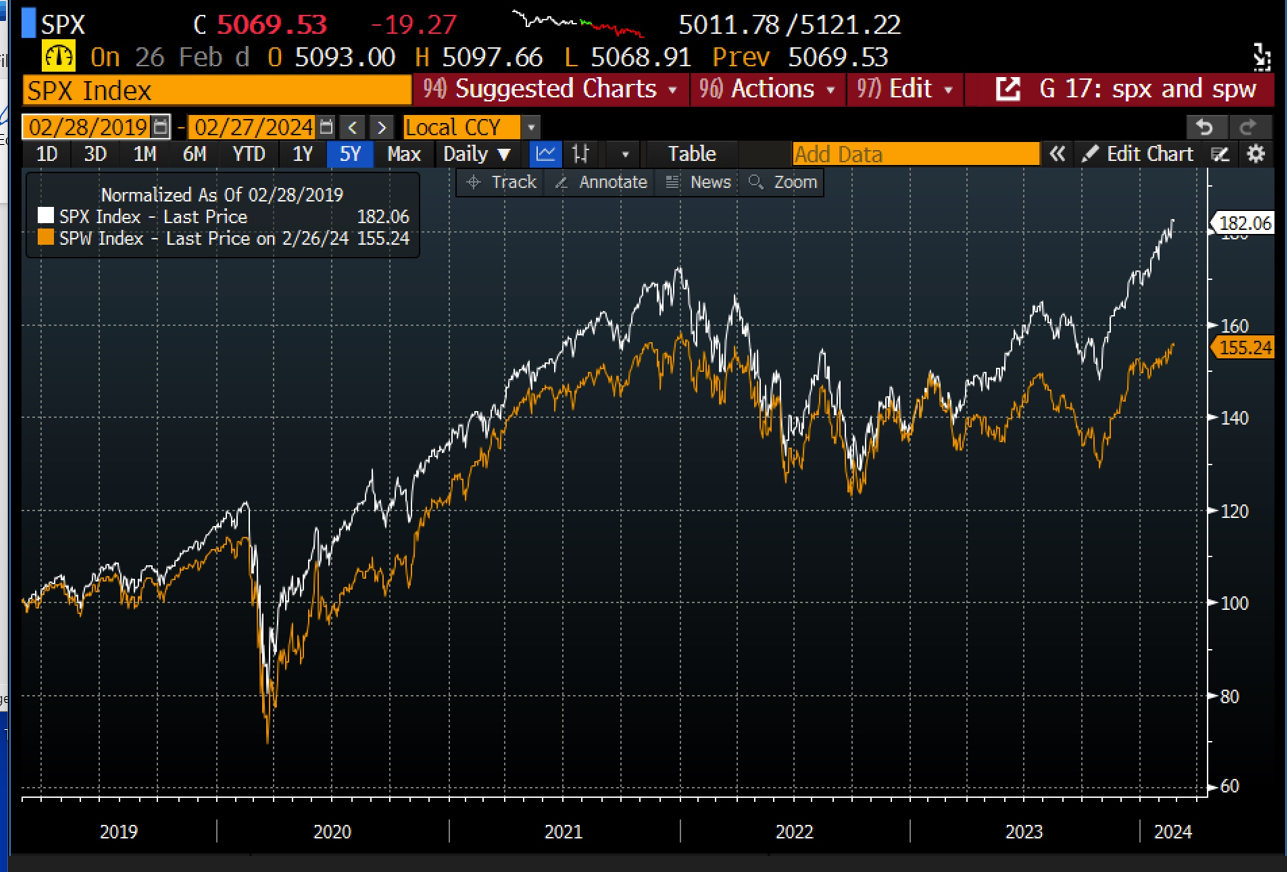
Source: XTB and Bloomberg
How does the S&P 500 compare to its international peers?
The focus has been on US shares for so long, that it is easy to forget that the Eurostoxx 50 index is outperforming the S&P 500 so far this year. The S&P 500 is higher by 6.28%, vs. 7.65% for the Eurostoxx 50. While no European companies have experienced the same level of return as Nvidia, ASML – the Dutch maker of semi-conductor production equipment – has risen by 25% YTD in USD terms. It is followed by Ferrari, up 23%, then Adyen the payments platform, followed by Italian bank Unicredit, which is higher by 21% YTD. On a 12-month basis, Unicredit is the best performing stock in the European index, it is up by 64%, followed by SAP, up 63%. ASML is higher by just over 50% in the last 12 months, although it seems to get a lot more attention than Europe’s non-tech stocks. Even the luxury sector, which can be considered Europe’s version of the ‘tech’ sector, is not driving the European market to record highs. Hermes is the tenth best performing stock in the Eurostoxx index in the last 12 months, and LVMH doesn’t feature in the top 10. On a year-to-date basis, Hermes and LVMH are the 7th and 9th best performing stocks on the European index.
Stock market performance is broad based
The next time you hear that this rally is driven only by tech, think again. The percentage of stocks in the S&P 500 that are above their 200-day moving average is nearly 70%, 61% of stocks on the S&P 500 are above their 50-day moving averages, suggesting that even the record high in the US blue chip index was not driven solely by tech. The same is true in Europe. In the Eurostoxx 50 index, the percentage of stocks above their 200-day moving average is 74%, with 72% of Europe’s largest companies above their 50-day moving average.
To conclude, this data shows that the rally in stocks in the US and in Europe is not particularly concentrated, and is not just fueled by tech. This suggests that the market is healthy and that the rally is broad based. Looking ahead, the US macro back drop is strong, which could support the overall US index in the near and medium term. The economic outlook for Europe is for stagnant growth this year, however, its biggest companies are global powerhouses. Due to this, we may continue to see a strong performance of the European index in the coming months, even if European economic data continues to weaken.
Author

Kathleen Brooks
XTB UK
Kathleen has nearly 15 years’ experience working with some of the leading retail trading and investment companies in the City of London.


