Australia’s third quarter Consumer Price Index will be released at the top of the hour, 00.30 GMT, whereby food, dwellings, electricity and domestic holidays are expected to continue driving headline inflation higher, though various state government energy rebates should provide an offset, the extent of which is highly uncertain, as analysts at Westpac argued.
Hence, Westpac anticipates 1.1% and 1.5% rises for the headline and trimmed mean CPI measures, respectively (market forecast: 1.6% and 1.5% respectively), taking the headline’s annual pace to 6.5% (market 7.0%).
Meanwhile, analysts at TD Securities expect a more dovish headline CPI print due to the significant offset from the rebates and lower pump prices. ''However, trimmed-mean CPI may stay elevated at 1.6% QoQ as broader price pressures are still brewing, especially in the housing and food categories. Unless trimmed-mean inflation is strongly higher, we expect the Bank to stick with 25bps hikes until March 2023.''
How might AUD/USD react?
The sentiment around the Federal Reserve monetary tightening and the policy direction of top trading partner China after President Xi Jinping have seen a lot of volatility in the price with the ATR picking up to over 100 pips for any given day. Therefore we could see some heightened volatility.
If the data comes in hot, given that the Reserve Bank of Australia only delivered a smaller-than-expected 25 basis point rate hike earlier this month, then there could be prospects of stronger action next time around that will only feed into the bullish AUD playbook.
The daily chart is neutral with both the upside and downside to play for at this juncture. However, the double top on the hourly chart shows the price under pressure:
AUD/USD H1 chart
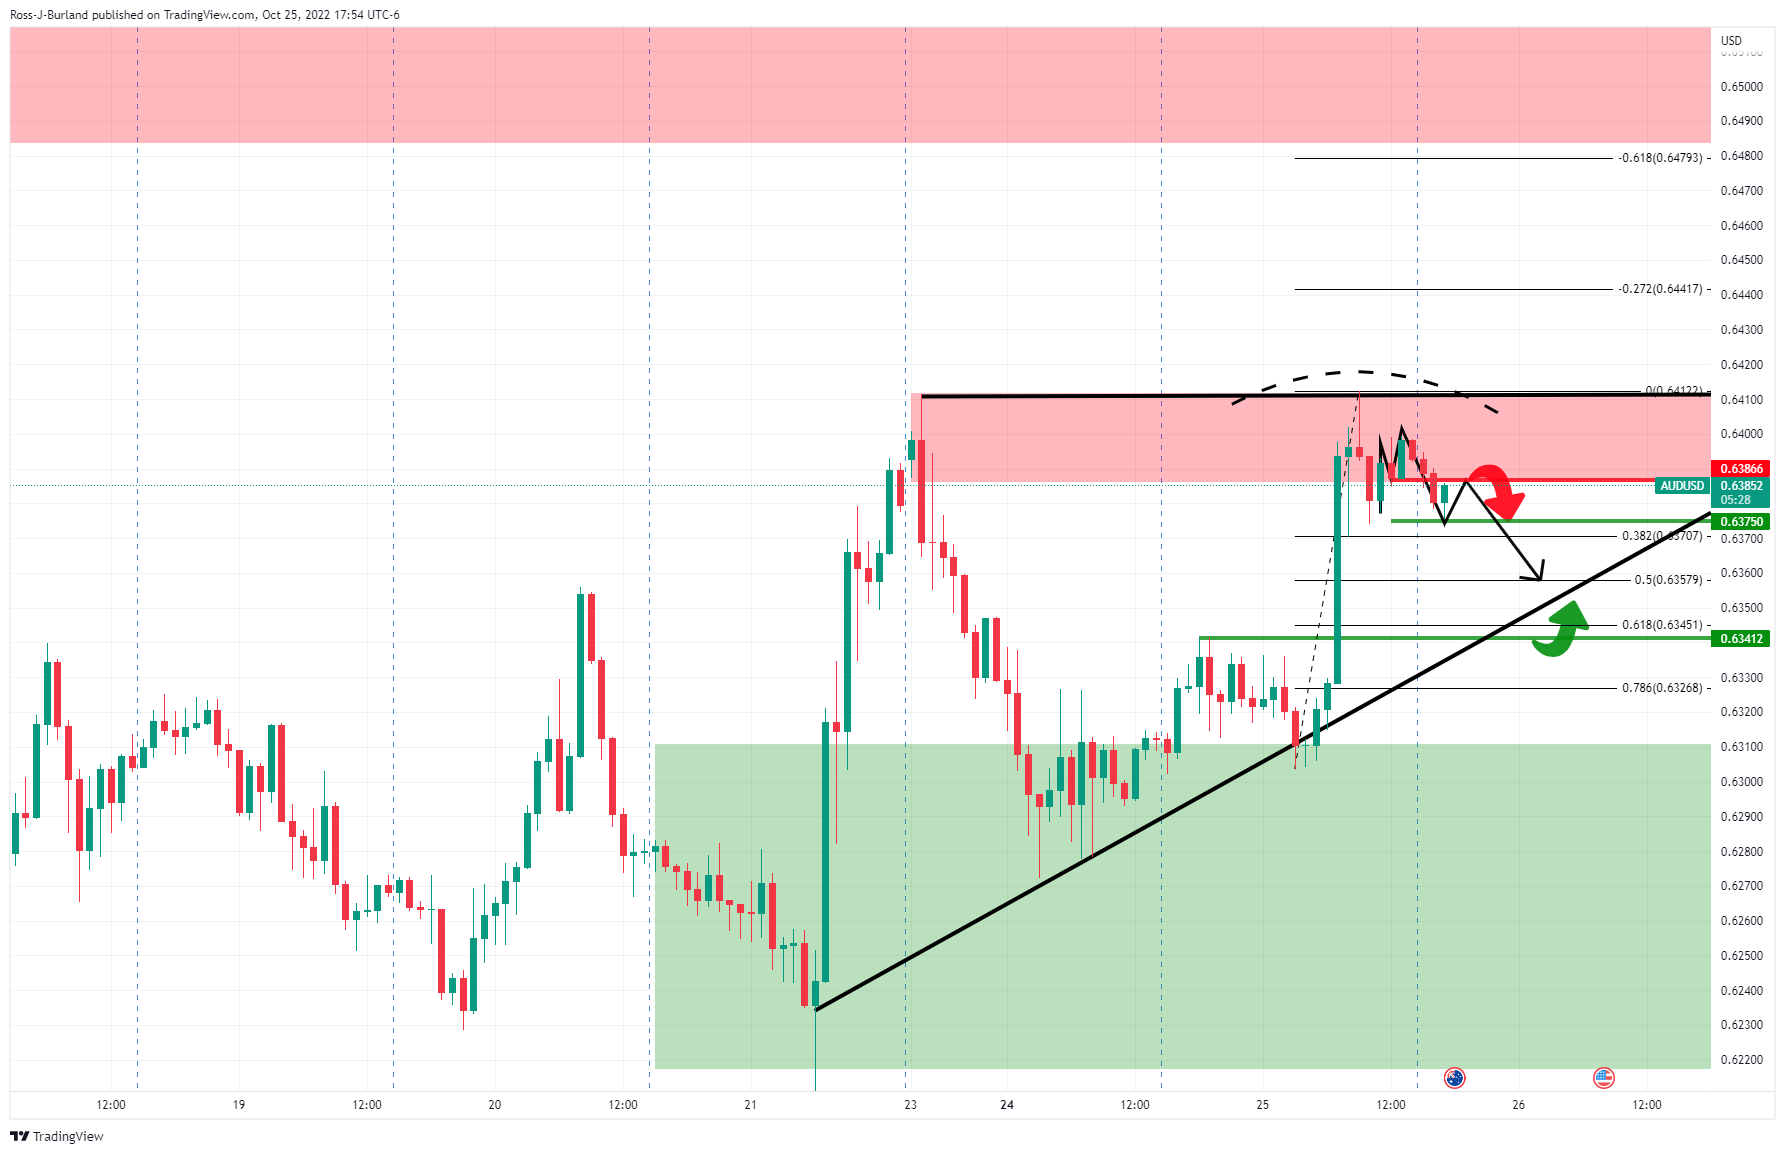
The price is coiling within a geometrical pattern and is forming an M-top with prospects of a move into mitigating the price imbalance of the hourly impulse towards trendline support.
About Aussie CPI
The Consumer Price Index released by the RBA and republished by the Australian Bureau of Statistics is a measure of price movements by the comparison between the retail prices of a representative shopping basket of goods and services. The trimmed mean is calculated as the weighted mean of the central 70% of the quarterly price change distribution of all CPI components, with the annual rates based on compounded quarterly calculations.
Information on these pages contains forward-looking statements that involve risks and uncertainties. Markets and instruments profiled on this page are for informational purposes only and should not in any way come across as a recommendation to buy or sell in these assets. You should do your own thorough research before making any investment decisions. FXStreet does not in any way guarantee that this information is free from mistakes, errors, or material misstatements. It also does not guarantee that this information is of a timely nature. Investing in Open Markets involves a great deal of risk, including the loss of all or a portion of your investment, as well as emotional distress. All risks, losses and costs associated with investing, including total loss of principal, are your responsibility. The views and opinions expressed in this article are those of the authors and do not necessarily reflect the official policy or position of FXStreet nor its advertisers. The author will not be held responsible for information that is found at the end of links posted on this page.
If not otherwise explicitly mentioned in the body of the article, at the time of writing, the author has no position in any stock mentioned in this article and no business relationship with any company mentioned. The author has not received compensation for writing this article, other than from FXStreet.
FXStreet and the author do not provide personalized recommendations. The author makes no representations as to the accuracy, completeness, or suitability of this information. FXStreet and the author will not be liable for any errors, omissions or any losses, injuries or damages arising from this information and its display or use. Errors and omissions excepted.
The author and FXStreet are not registered investment advisors and nothing in this article is intended to be investment advice.
Recommended content
Editors’ Picks

Gold: Trade war fears lift Gold to new record high
Gold shined as the go-to safe-haven asset amid growing fears over a deepening global trade war. US tariff announcements and key employment data could lift XAU/USD’s volatility. The technical outlook points to overbought conditions in the near term.

EUR/USD: US Dollar to fall further despite ruling uncertainty
The EUR/USD pair remained under selling pressure for a second consecutive week but ended it little changed at around 1.0820. The US Dollar remained trapped between tariff-related concerns and tepid US data, limiting its safe-haven condition.

GBP/USD picks up pace and retests 1.2960
GBP/USD now capitalises on the Greenback's knee-jerk and advances to the area of daily peaks in the 1.2960-1.2970 band, helped at the same time by auspicious results from UK Retail Sales.

Week ahead: US NFP and Eurozone CPI awaited as tariff war heats up, RBA meets
Trump’s reciprocal tariffs could spur more chaos. US jobs report might show DOGE impact on labour market. Eurozone inflation will be vital for ECB bets as April cut uncertain. RBA to likely hold rates; Canadian jobs, BoJ Tankan survey also on tap.

US: Trump's 'Liberation day' – What to expect?
Trump has so far enacted tariff changes that have lifted the trade-weighted average tariff rate on all US imports by around 5.5-6.0%-points. While re-rerouting of trade will decrease the effectiveness of tariffs over time, the current level is already close to the highest since the second world war.

The Best brokers to trade EUR/USD
SPONSORED Discover the top brokers for trading EUR/USD in 2025. Our list features brokers with competitive spreads, fast execution, and powerful platforms. Whether you're a beginner or an expert, find the right partner to navigate the dynamic Forex market.