Introduction
VolatilityMarkets suggests top quant trade ideas to take advantage of trending markets.
Market summary
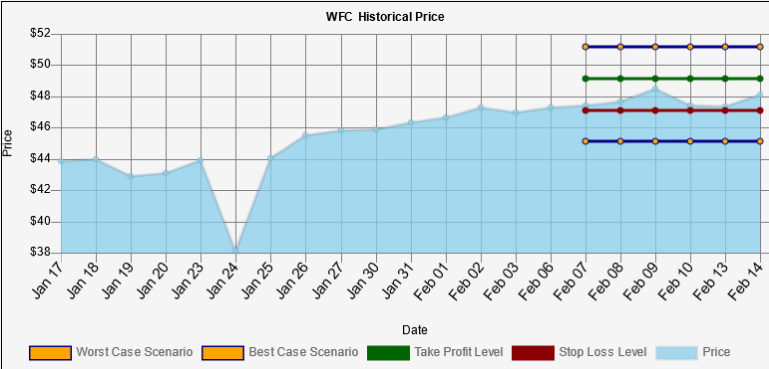
WFC last price was $ 48.13. In the short term Wells Fargo has been accelerating higher. In the long term Wells Fargo has been accelerating higher. Over the past 20 days, the WFC price increased 15 days and decreased 5 days. For every up day, there were 0.33 down days. The average return on days where the price increased is 2.0181% The average return on days where the price decreased is -3.736% Over the past 20 Days, the price has increased by 9.79% percent. Over the past 20 days, the average return per day has been 0.4895% percent. With the long term trend being the stronger of the two, we propose a long trade idea with an overnight time horizon.
The trade idea
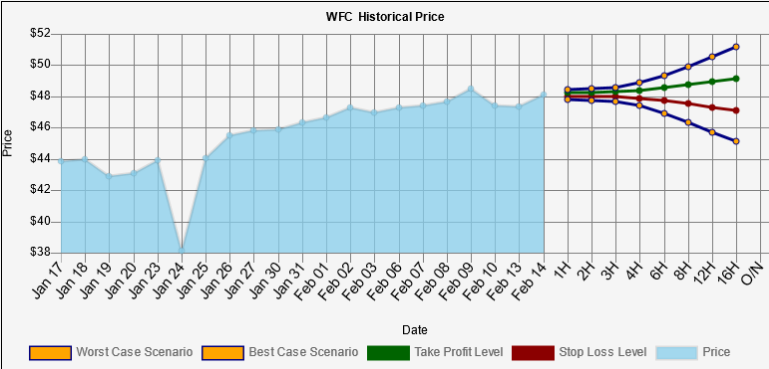
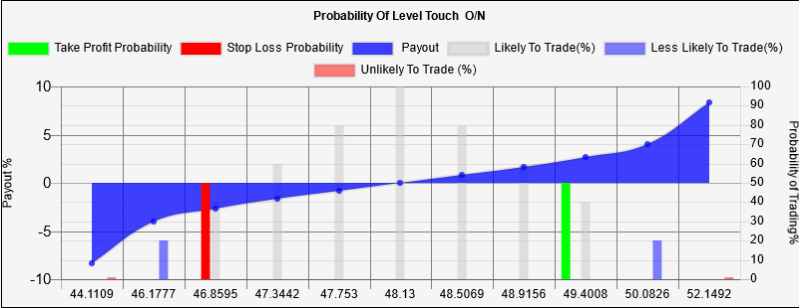
Buy $ 47,450 USD of Wells Fargo, take profit at $ 49.1444 level with 50.0% odds for a $ 1,000 USD gain, stop out at $ 47.1157 with 50.0% odds for a $ 1,000 USD loss through O/N time horizon.
Intraday Predictions
WFC trend analysis
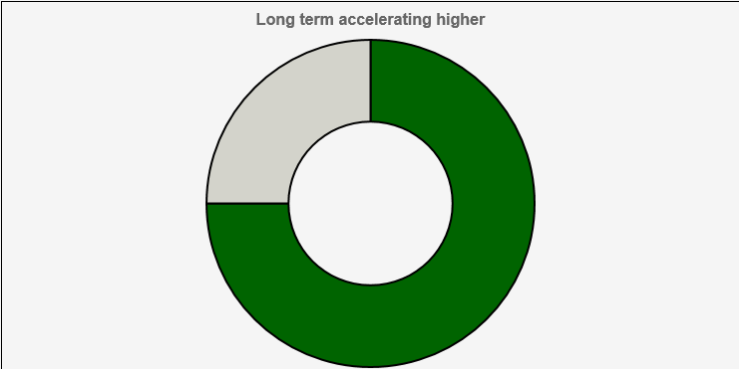
WFC last price was $ 48.13. The long term trend accelerating higher is stronger than the short term trend accelerating higher. This trade goes long when price has been moving higher and accelerating over the past 20 days.
WFC value analysis
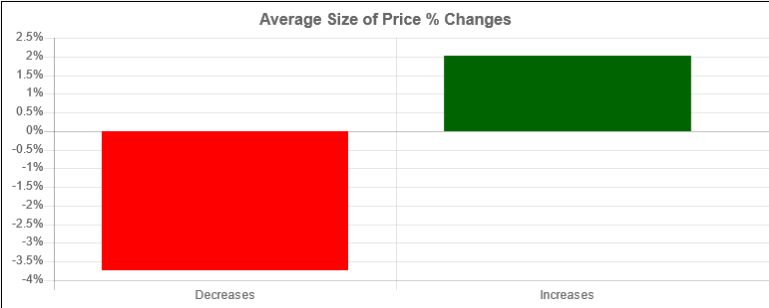
Over the past 20 days, the WFC price increased 15 days and decreased 5 days. For every up day, there were 0.33 down days. The average return on days where the price increased is 2.0181% The average return on days where the price decreased is -3.736% Over the past 20 Days, the price has increased by 9.79% percent. Over the past 20 days, the average return per day has been 0.4895% percent.
WFC Worst/Best Case Scenario Analysis
Within 1 week, our worst case scenario where we are 95% certain that this level won't trade for WFC, is $ 45.1054, and the best case scenario overnight is $ 51.1546. levels outside of this range are unlikely, but still possible, to trade. We are 50% confident that $ 47.1157 could trade and that $ 49.1444 could trade. These levels are within statistical probability.
Key Takeaways:
-
Price today $ 48.13.
-
Over the past 20 days, the WFC price increased 15 days and decreased 5 Days.
-
For every up day, there were 0.33 down days.
-
The average return on days where the price increased is 2.0181%.
-
The average return on days where the price decreased is -3.736%.
-
Over the past 20 Days, the price has increased by 9.79% percent.
-
Over the past 20 days, the average return per day has been 0.4895% percent.
-
Over the past 20 days, The price has on average been accelerating: $ 0.0353 per day higher.
-
Over the last session, the price increased by $ 0.79.
-
Over the last session, the price increased by 1.6414 %.
-
Over the last session, the price accelerated by $ 0.725.
Volatility Markets provides trend following trade ideas for momentum traders. The Volatility Markets Newswire measures the direction and acceleration of a security and then structures a trade idea to capitalize on the trend. While trends have been shown to exist in markets over the past 100 years, they are no guarantee of future asset prices. You should take these ideas lightly and at your own risk.
Recommended content
Editors’ Picks

AUD/USD hung out to dry on familiar low end
AUD/USD tried and failed to spark a bull run during the first trading session of 2025, rising on thin volumes before collapsing back into the 0.6200 handle in the later hours of the day. A broad-market push into the safe haven Greenback kept the Aussie pair on the defensive, and the AUD is mired in congestion on the weak side of two-year lows.

USD/JPY flirts with multi-month highs in the 158.00 region
The USD/JPY pair traded as high as 157.84 on Thursday, nearing the December multi-month high of 158.07. Additional gains are on the docket amid prevalent risk aversion.

Gold flat lines above $2,650 ahead of US PMI release
Gold price consolidates its gains near $2,660 after reaching a two-week high during the early Asian session on Friday. The safe-haven flows amid the geopolitical tensions provide some support to the precious metal.

Could XRP surge to new highs in January 2025? First two days of trading suggest an upside bias
Ripple's XRP is up 7% on Thursday, extending its rally that began during the New Year's Day celebration. If long-term holders continue their recent accumulation, XRP could overcome the $2.9 resistance level and aim for a new all-time high.

Three Fundamentals: Year-end flows, Jobless Claims and ISM Manufacturing PMI stand out Premium
Money managers may adjust their portfolios ahead of the year-end. Weekly US Jobless Claims serve as the first meaningful release in 2025. The ISM Manufacturing PMI provides an initial indication ahead of Nonfarm Payrolls.

Best Forex Brokers with Low Spreads
VERIFIED Low spreads are crucial for reducing trading costs. Explore top Forex brokers offering competitive spreads and high leverage. Compare options for EUR/USD, GBP/USD, USD/JPY, and Gold.
